Traffic Structure
Analyze the Performance of Digital Channels
Use Traffic Structure Insights to Increase Marketing ROI
Introducing Traffic Structure
Analyze Channel Performance
Traffic structure offers granular insights about the performance of your different marketing channels. Direct, email, paid ads, organic search, social media, referrals, and now traffic forwarded by AI: see all the important metrics for each, and then use this data to tailor content to visitor segments.
With TWIPLA, analyzing traffic structure is easy. Understand the performance of tributaries by using our interactive graphs, and also compare results over time. Use custom traffic parameters or leverage our filtering engine and get the insights you need to increase engagement and also achieve goals.
Why Use Traffic Structure Stats?
- Grasp site engagement for different channel visitors.
- Improve decision-making with channel insights.
- Better budget allocation based on channel data.
- Enhance content targeting to different online channels.
Granular Traffic Structure Analytics
Optimize Outreach with Channel-Specific Insights
Traffic Channels
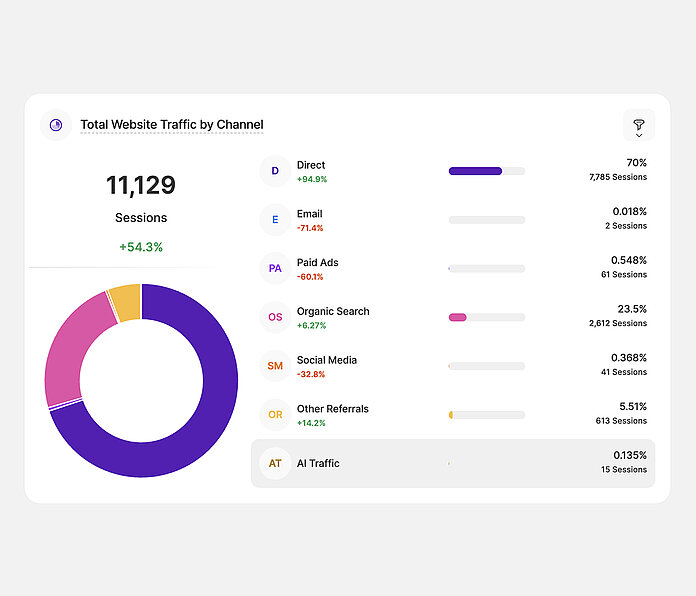
Visitor Distribution by Channel
Jump into traffic structure and identify your most successful feeder channels. See the total sessions segmented by channel type of origin, with a mouse hover also revealing a further breakdown by social media account, search engine, referral site name, etc.
- Direct Traffic: Sessions who come to your website by directly typing your website’s URL into their browser’s address bar.
- Email: Sessions originating from email marketing campaigns, tracked when specific tags are included as parameters in the URLs contained within your campaigns.
- Paid Ads: Sessions coming from search engine results of paid advertising, either across search ads or due to a targeting strategy.
- Organic Search: Sessions who discover your website through unpaid search engine results such as Google or Bing.
- Social Media: Sessions originating from social media platforms such as Facebook, Instagram, LinkedIn, X, and others.
- Other Referrals: Sessions with a defined referrer that cannot be associated with another channel.
- AI Traffic: Sessions forwarded to your website from AI platforms such as ChatGPT, Gemini, Microsoft Copilot, and Perplexity. These are forwarded visits, not visits from AI bots or crawlers.
All the key data is clearly displayed, from the percentage of all sessions to how numbers have changed during the time period of your choice. Then, go deeper. Activate a multi-level filter or filter template. Get the data you need for the work you're doing today.
So understand where your website visitors are coming from. Then, use this insight to tailor your marketing strategies to the most effective digital channels. Allocate resources effectively, and also focus your outreach on the channels that get you the best results.

Custom Traffic Parameters
Associate Landing Page Traffic to Any Category or Channel
TWIPLA provides rich traffic insights straight out of the box. But you can also use GET parameters to quickly customize data collection for even more detail and accuracy.
Simply add these key-value pairs with category and channel inputs to your landing page URLs, and our platform will handle the rest.
So use TWIPLA for a deeper understanding of how your audience interacts with webpages and UTM Campaigns. Get the insights you need to start optimizing your marketing strategies today!
Traffic Channels
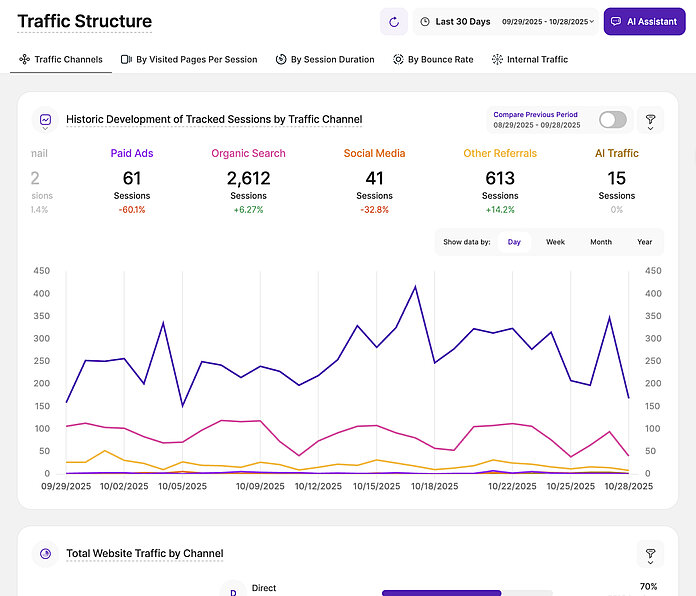
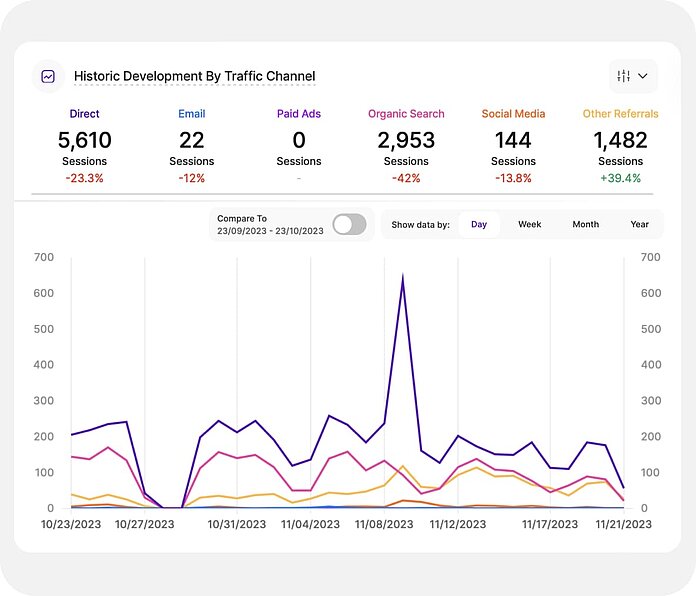
Historic Trends by Channel
Alternatively, focus on how your different channels have developed over time. Scroll down to the interactive graph and see how your tributaries have performed during the time frame of your choice. Pinpoint peak performance periods and identify lulls for each.
View all of them together, or see only the channels you want. Compare results during two time periods of your choice, with a mouse hover pulling up a window of additional information. It's all highly intuitive, and we've also included help boxes everywhere.
So understand the historic development of your online presence, broken down by digital channel. Also identify trends that are impacting the effectiveness of each. Then, use these insights to inform budgeting decisions, resource allocation, and campaign focus.
Visited Pages Per Session
Page Views For Each Channel
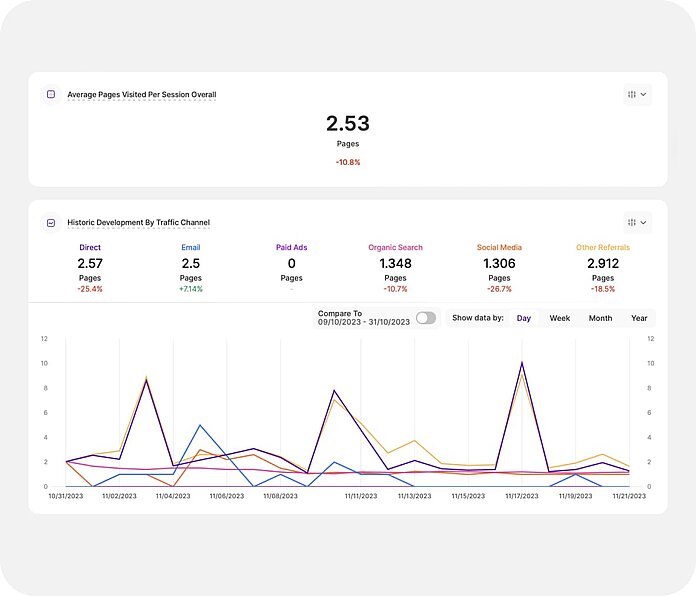
Next, use traffic structure to understand which channels brought in the most curious visitors. Identify the channels that persuaded visitors to view the most webpages during their sessions, as well as others that attracted people less interested in finding out more.
See the average page count for users from each channel, with the interactive graph bringing data to life. View data by day, week, month, or year, and compare two different time periods of your choice. Quickly identify spikes, drop offs, and also wider trends.
So use traffic structure to identify whether users are engaging with the content you're sharing through each channel. Use these insights to improve relevance. Guide content delivery. Make user experience improvements. Then, return later to assess results.
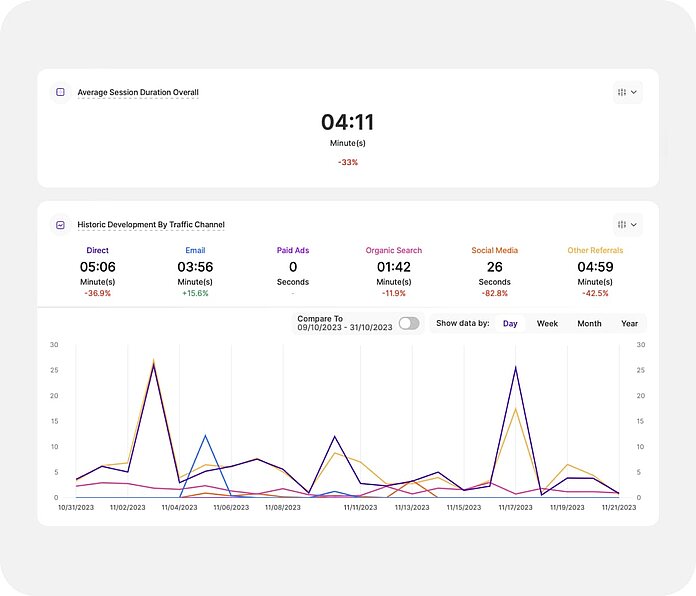
By Session Duration
Visit Length For Each Channel
Alternatively, see how long channel visitors spent on your site. Do they stay for a long time to really absorb your website content, or do they disappear quickly? Identify channels whose visitors cut their time short, and then create content to make them stay longer.
See the average website session duration, and compare this with the visit length for each channel. See how this has changed over time, or compare time periods in graph mode. Add a multi-level filter. Get the information you need to better understand channel engagement.
So use this data to understand how interested different channel visitors are in your website, products, and services. Assess the quality of your content for different traffic sources, and use these insights to further tailor content to these different audience types.
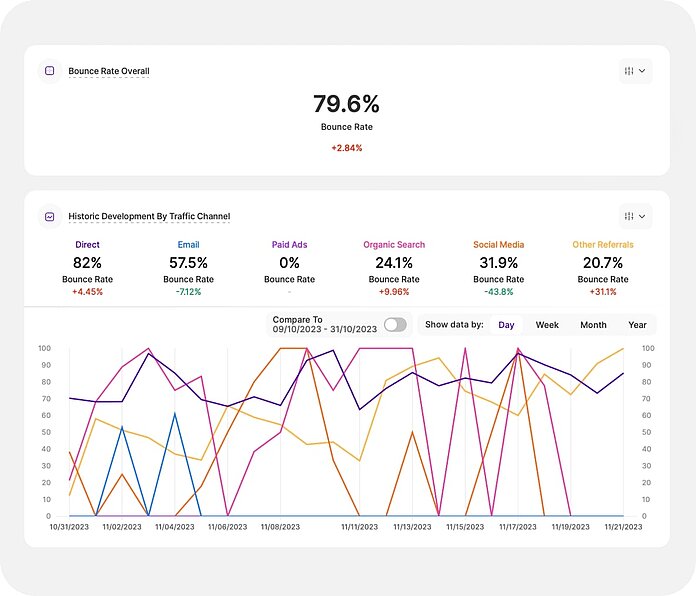
By Bounce Rate
Single-Page Visits by Channel
Finally, see the average website bounce rate, and compare it with your different channels to understand the appeal of entry pages for various audience segments. Know how many visitors from each are leaving your website without moving beyond the landing page.
Use the interactive graph to compare any traffic channels you want. See how the bounce rates have changed historically, or compare two time periods. Quickly identify channel visitors that are engaging with your website, and others that lose interest immediately.
So use traffic structure to see how much your content resonates with each channel's audience. Then, use these insights to tailor landing pages to these different segments. Give visitors more of what they want, and better meet their expectations and intent.