eCommerce Statistics
Turn More Store Visitors into Customers
Use eCommerce Statistics to Drive Retail Growth

Overview: Bird's Eye View of Top-Level eCommerce Statistics.
Customers: A database of customer details and purchase histories.
Sales Charts: Analyze sales by product, purchase process, and channel.
Introducing eCommerce Statistics
Master the Online Retail Game
eCommerce Statistics is a powerful feature that online sellers can leverage to guide the growth of their retail store and drive success. Use it to gain granular insight into customers and prospects, the popularity of different products, and wider purchasing behavior.
TWIPLA has every tool needed to monitor revenue, improve store design, optimize offerings, and boost marketing effectiveness. And since the eComm feature is part of a complete website intelligence solution, this makes us an ideal companion for your business.
Why Use eCommerce Stats?
- Target the right audience with personalized content.
- Effectively enhance design, UX, and product offerings.
- Make informed decisions that will grow sales and revenue.
- Track KPIs, identify trends, and outpace the competition.
Enjoy a 360° View of Your Customers and Webstore
Overview
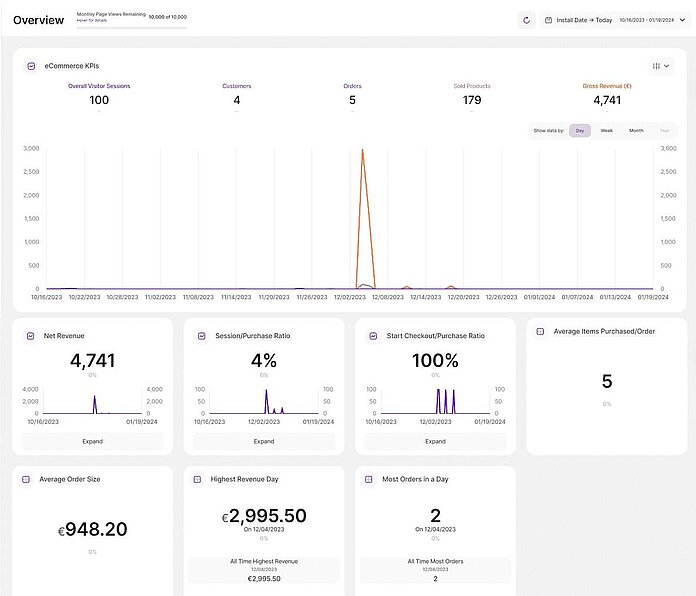
See all the important eCommerce store metrics at a glance, filterable to the time period of your choice.
- Total Visitor Sessions
- Customer Count
- Order Count
- Sold Product Count
- Gross Revenue
- NET Revenue
- Session/Purchase Ratio
- Start Checkout to Purchase Ratio
- Average # Items per Order
- Average Order Value
- Highest Revenue Day
- Highest Sales Day
- Most-Sold Products
- Most-Viewed Products
Overview
View All Your eCommerce KPIs
Jump into the overview and see all the performance metrics that matter. Assess the overall health of your store, and how this has changed over time. Track growth, engagement, and revenue at a glance and monitor the impact of any optimization activates.
Then, analyze visitor behavior and sales patterns. Understand your income stream and the effectiveness of sales funnels. Know shopping habits, transaction volumes, and peak activity periods, and leverage this intelligence to make informed marketing decisions.
The eCommerce Statistics overview also offers deep insights about your products and inventory. Identify your best performing items and opportunities for optimization or promotion. Use the data to enhance your product offering and customer experience, and drive sales!
Customers
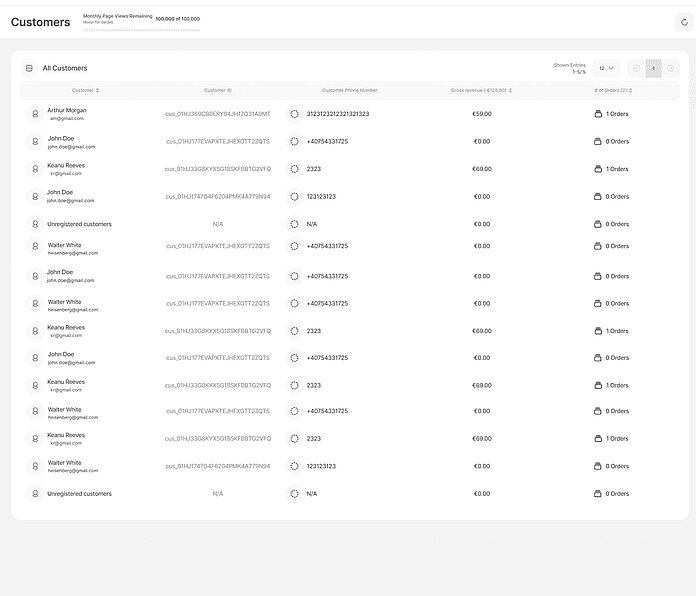
Client Data Hub
Next, dive into the eCommerce Customers module and keep track of everyone who has bought from your store. See all the important information in one place, including their names, IDs, and phone numbers, as well as the gross revenue and order count for each.
This dynamic feature makes it really easy to see at a glance who bought what, and to identify the top customers in your community. Use it to gauge customer retention, and to also pinpoint fertile opportunities for personalized marketing and store promotions.
Leverage this tool to significantly enhance your customer database management. And by analyzing customer spending patterns, it's a great way to increase loyalty and optimize revenue by targeting the customers that have proven themselves most likely to buy from you.

TWAIA: Your AI Analytics Assistant
Advice and Guidance Whatever Your Query
TWAIA follows you across TWIPLA, ready to answer any question, explain metrics in plain words, and guide you at every step. She’s your always-on AI copilot inside the platform, transforming raw data into crystal-clear insights and turning tricky analytics into guidance so simple it feels like magic.
Available to all Premium Plan users, TWAIA highlights visitor behaviors that matter most, like showing where people get stuck, which session recordings to watch, and which frustration signals might be hurting conversions.
And if you ever need a human touch, live chat support is also only a click away.
TWIPLA HAS WON 60+ ANALYTICS AWARDS SINCE 2019


Understand your retail store and customers from every angle.
Know which digital channels are bringing in the most sales.
Monitor your store's sales process and funnels to purchase.
Sales Charts
Granular eCommerce Insights
Finally, assess product performance. Gain insight into the popularity of each, including Revenue by Product (RON), units sold, and related KPIs. The interactive graphs make everything easy to grasp, enabling you to quickly make data-driven inventory and marketing decisions.
Alternatively, use this eCommerce Statistics module to analyze conversion rates, checkout initiations, and cart views. Leverage these insights to gain a deep understanding of the customer journey, and to find effective ways to optimize your store's sales processes.
Sales charts also shows which online sources are bringing in the most converting visitors. Leverage this tool to track orders and events from different online sources, and to inform resource allocation and campaign optimization across your different channels.

Comprehensive Website Intelligence
Go Beyond eCommerce Stats
TWIPLA is so much more than an eCommerce analytics platform. Sign up today and gain access to a complete toolkit of analytics features that incorporates complete website statistics, behavior analytics features, and also visitor communication modules.
The platform is powered by a cookieless tracking system and can be used legitimately under every global privacy law without visitor consent. This enables you to remove your cookie banner, and collect up to five times more data than with competitor platforms.
This advanced engine also facilitates immediate data processing and up-to-the-second reports, with none of the batching and 48-hour delays common with competitors. So choose TWIPLA, get your insights when you need them, and supercharge eComm success.