- Why Us?
- Features
White Label
For SaaS Platforms & Agencies
Provide our complete analytics suite to your clients, directly within your own interface and with your/their own branding. Discover Analytics-as-a-Service and White Label Analytics. Great benefit, minimal effort.
- Pricing
- White Label
- Success Stories
- ResourcesGetting Started
Web Statistics
Complete Website Statistics - Panoramic Analytics - Enjoy the View
Scroll to See the Website Statistics
Or Click the Icon For Further Details
eCommerce Statistics
Enhance Webstore Performance
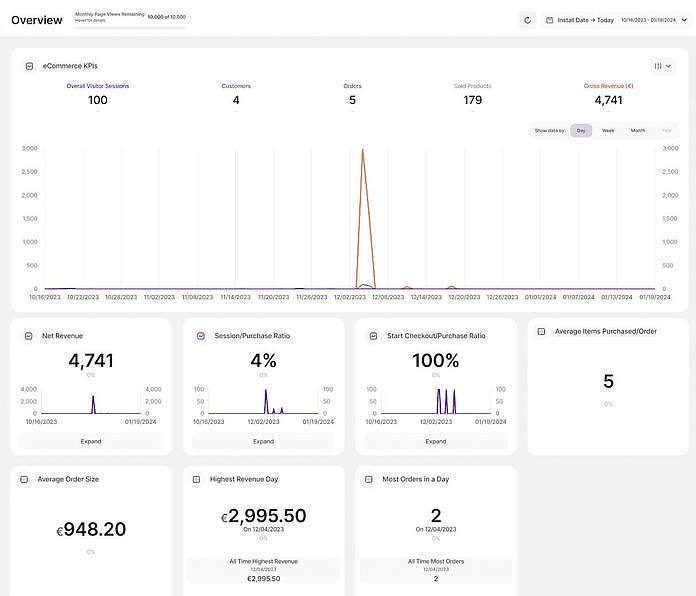
Reach your online store goals faster with our powerful eCommerce Statistics tool. Not only can you access all the key metrics you need, but also monitor your business’ health over time. In addition, you can evaluate store performance, track progress, and plan your outreach strategies to drive growth.
Top-Level KPI OverviewHistoric Customer DatabaseProduct Performance TrackingConversion AnalyticsPurchase Patterns by Traffic Source
The toolkit also includes a detailed customer database with contact information and purchase history. Moreover, with in-depth sales data, TWIPLA helps you improve your product stock, sales methods, and even promotions.
Overview
All the Essential Stats at a Glance
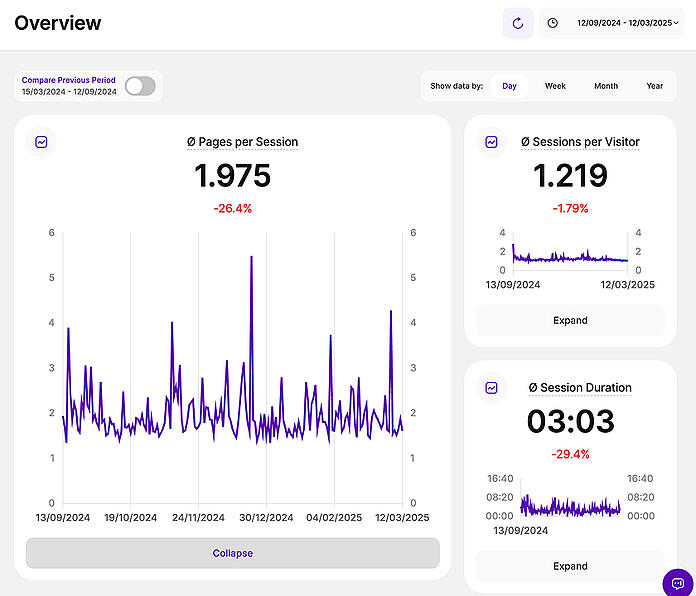
First, use Statistics Overview to get a clear view of your website's performance. Then, see how things have changed this month or choose a custom time period to track changes over any time. Finally, check back later to see the overall results of your site improvements.
Key Visitor & Session DataCritical Metrics SnapshotAdjustable Time IntervalsComparative Benchmarking
View each KPI as a graph or explore other visual options. Additionally, click on any one to dive deeper and find ways to improve. Remember, our data updates instantly, unlike other platforms that process data in batches.
Making the Website Statistics Work for You
Multi-Level Filtering
Saveable Filter Templates
One-Click Visitor Segments
Visitor Segments
Powerful Audience Filtering
Visitor Segments is a new filtering tool that helps you easily explore website data and customer demographics. For example, you can set one up in seconds, activate it in the Pages Dashboard with one click, and then quickly gain deeper insights into your website.
Use this tool to sort report data by specific visitor details. Furthermore, break down and compare your audience by location, devices, pages they visit, and companies they belong to. So focus on what matters and get the insights you need.
Traffic Structure
Stats on Channel Performance
Direct, email, paid ads, organic search, social media, and referrals; therefore, know exactly where website visitors come from, with TWIPLA breaking down data by traffic source. Additionally, use Traffic Structure for top-level analytics for each channel side-by-side. Finally, immediately see your strengths and weaknesses.
Visitor Distribution by ChannelHistoric Trends by ChannelVisited Pages Per SessionBy Session DurationBy Bounce Rate
Compare how your traffic sources perform. Check color-coded graphs and charts, and hover your mouse to see extra details. Focus on the channels that work best or improve the ones that need attention.
Outgoing Traffic
Follow Visitor Exit Paths
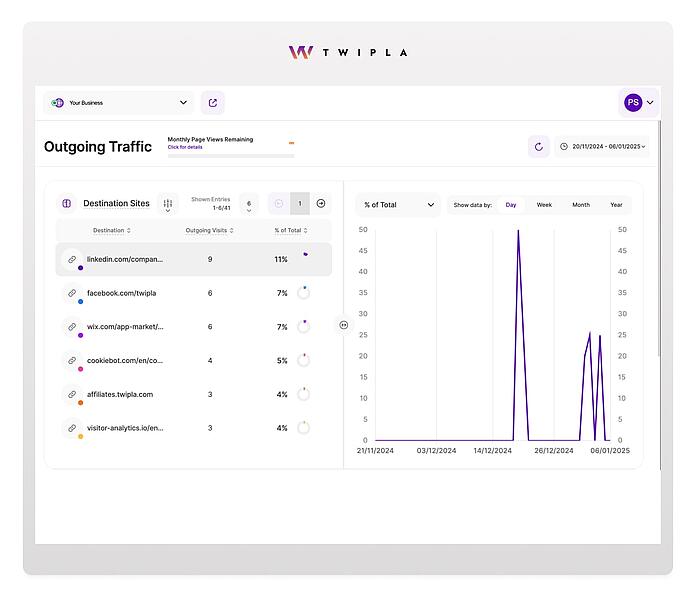
Your website doesn’t just bring in visitors; instead, it also shapes where they go next. Therefore, learn about this behavior, improve your site’s role in the digital world, and sharpen your strategies and partnerships.
Track Outgoing Visits Identify Top Destinations Sites Compare Traffic Flows
Use Outgoing Traffic to learn more about your visitors, work better with affiliates, spot interest in competitors, and gain a clear advantage in your industry. Then, turn visitor exits into useful insights to make your website’s outgoing links more effective.
Visitors
Turn Visitors into Insights
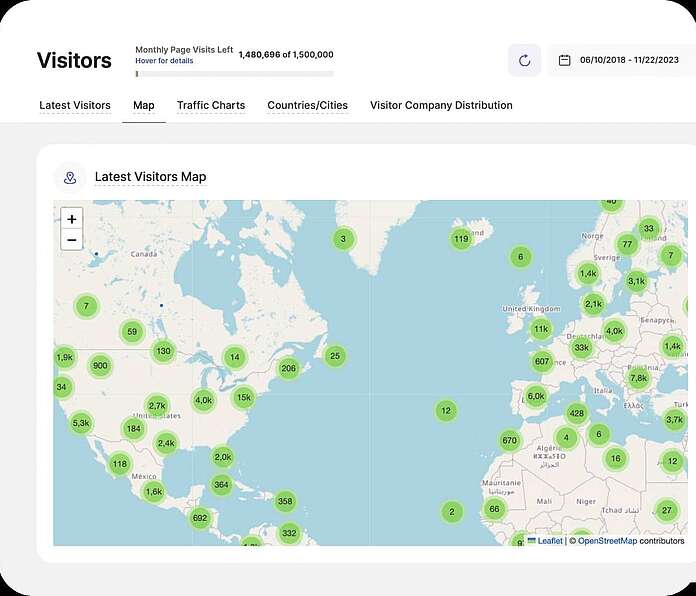
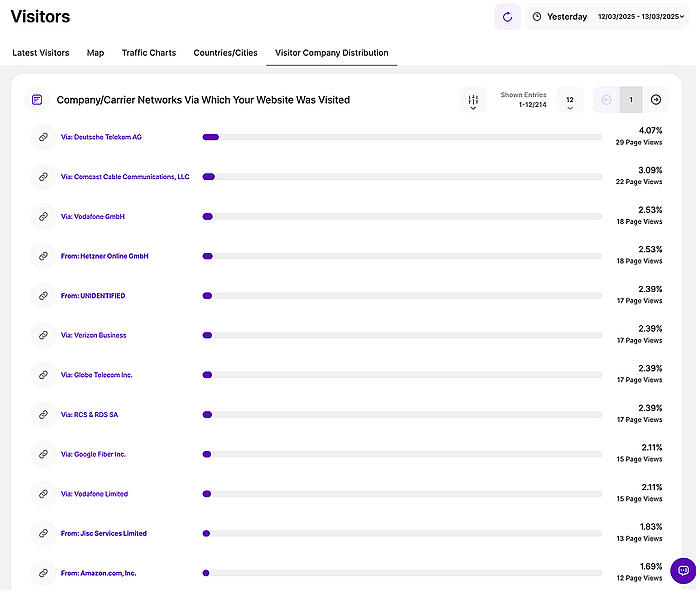
Learn about your website visitors and also how they interact with your content. Next, see their device preferences, browsing habits, and approximate locations. Then use these insights to adjust your site for your audience and boost success.
Detailed Visitor StatisticsCountry and City RankingsGeolocational MapWeekly Traffic ChartsVisitor Company Distribution
Go further by analyzing visitor data as a whole. Next, find peak browsing times and page load patterns. You can also discover the most popular countries, cities, and associated businesses. Then, use this data to plan your language options, publishing schedule, and broader strategies.
Pages
Identify the Top Webpages
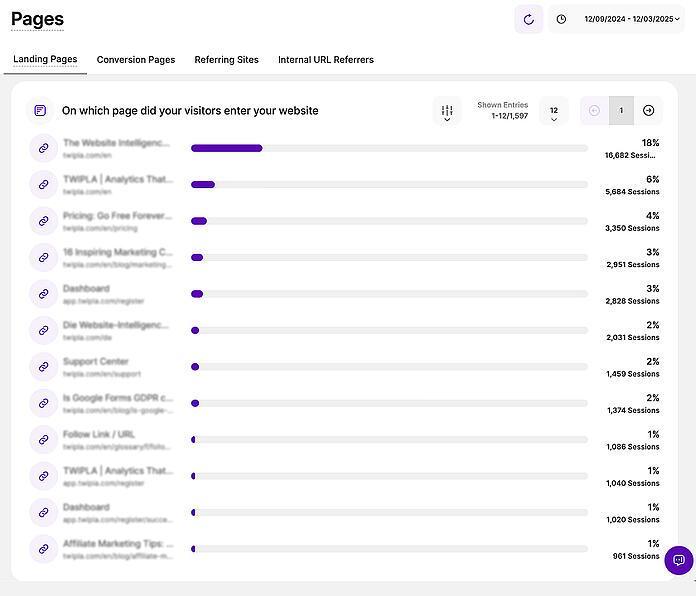
See how your pages perform, both individually and in context. Next, find out which ones are the main entry points and which are driving conversions. For deeper insights into visitor behavior, also activate a conversion funnel or page heatmap.
Page VisitsLanding PagesConversion PagesReferring Sites
Use Pages to quickly check which referring sites bring in the most traffic and how many sessions each generates. Then, click the link icon to visit the source, or click the referring site name to see which pages visitors arrived on from that site.
Competition Analysis
See Industry Standards
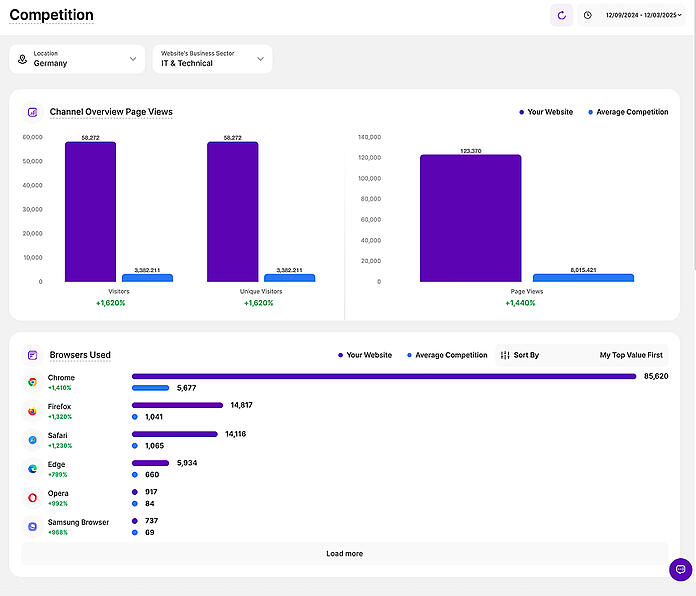
Website success doesn’t happen in isolation. Instead, insights often need context. That’s why you should use Competition Analysis to see how your website performs compared to other industry players in different locations. Then, use these insights to set clear goals.
Compare Data By IndustryBenchmark Traffic MetricsBrowser StandardsOperating System UsageScreen Resolution StandardsDevice Usage
Competition Analysis is key for smart decision-making. Use it to compare performance, learn market trends, and spot gaps in products or content. You can also reduce risks, uncover audience insights, and find new inspiration. Then, apply this data to stay ahead in your industry.
Devices
Optimize to Technical Choices
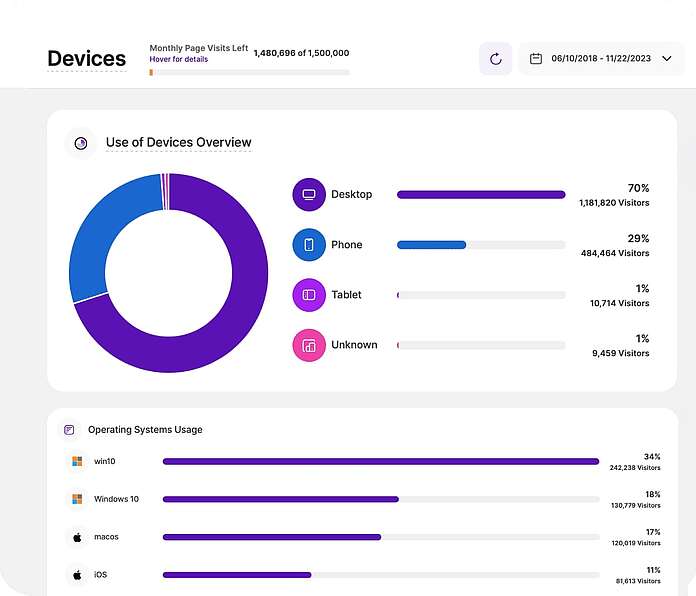
Learn which devices your visitors prefer and also what technical problems they experience. See how many use smartphones, desktops, or tablets with easy-to-read charts that clearly display the data. Then, use these insights to improve your site’s functionality for your audience.
Device UsageOperating System PreferencesBrowser ChoicesScreen Resolution Usage
Use Devices to find out about software preferences too. You can also use detailed hardware and software filters across the TWIPLA platform to uncover valuable new insights. Then, use this data to analyze website performance, adjust content, fix bugs, and plan smarter strategies.
UTM Campaigns
Stats on Marketing Initiatives
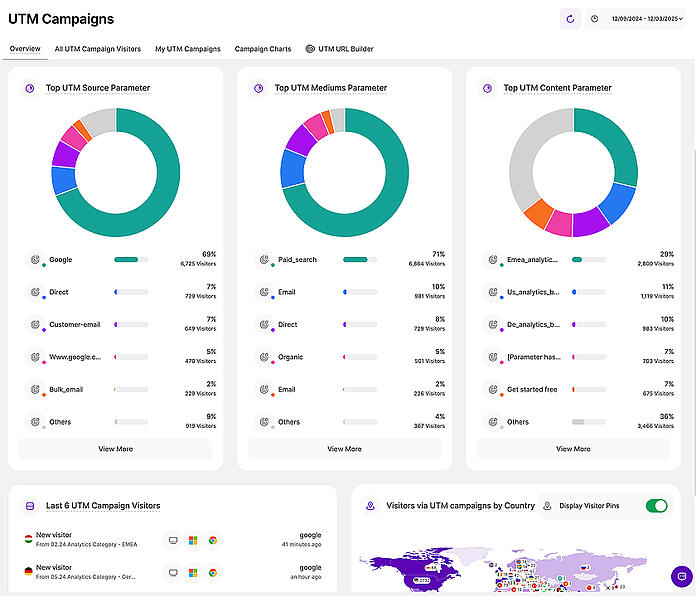
Analyze a single campaign or, alternatively, combine multiple elements using a TWIPLA UTM code. Furthermore, use it to track performance across as many channels as you want and see exactly who visits your site from each campaign.
UTM URL BuilderUTM Campaigns OverviewLatest Campaign VisitorsIndividual Campaign AnalyticsUTM Campaign Charts
Use insights from UTM Campaigns to improve your content and make smarter decisions. Additionally, you can use UTM tracking for visitor segmentation and A/B testing. This level of detail helps increase ROI and keeps your outreach effective.
Company Reveal
Detect Prospect Interest
Find out which companies show interest in your site and also exactly what they engage with. Then, use these insights to boost lead generation, study competitors, and understand buyer intent. This tool is key for B2B businesses, especially for those targeting enterprise clients.
Visitor Business NamesLeverage Intent for ABMEnrich Your ICPsAdd More Visits to Your PipelineCompany Reveal Breakdown
Company Reveal shows businesses that have registered their IP address with a business network provider. Use this data to get insights for ABM campaigns, improve ICP development, and then add more visits to your sales pipeline.
Resource Hub
What Is Website Analytics? Your Comprehensive Guide to a Martech Cornerstone
Marketers value website analytics for its ability to boost conversions and reduce marketing spend. So, learn what web analytics is and how to use it. Discover more details now!


