User Experience Analytics: Definition, Strategy, and Top Tools

Simon Coulthard April 02, 2024
8 Minute Read
CONTENTS

According to the researchers at Forester, every $1 invested in UX yields a return of $100.
That's massive, and highlights just how essential user experience analytics has become for digital success. Providing internet users with an enjoyable experience is no longer an advantage but an expectation and these tools show businesses what they need to do to achieve this.
Thankfully, it's not a complicated process because of advancements in modern UX analytics technologies. Today, there's no shortage of options and this blog will showcase the five best platforms on the market, and explain how to build them into business strategies.
Let's dive in!
Get Monthly Website Intelligence Insights
Keep pace with the fast-moving world of privacy-first analytics. Subscribe to our newsletter and get monthly TWIPLA updates alongside digital optimization intelligence, direct to your inbox.
SUBSCRIBE
What is User Experience Analytics?
User experience data analytics - otherwise known as UX analytics - refers to the process of learning how internet users interact with a website or app. This includes how they interact with and navigate between web pages and the effectiveness of key conversion pathways.
These are all fascinating insights that enable businesses to understand their digital presence from the perspective of their audience. Ultimately, UX analytics enables them to make data-driven decisions to improve website or app design, to identify bugs and bottlenecks, and to ensure that the user experience is as frictionless and enjoyable as possible.
UX analytics does this by collecting and interpreting quantitative and qualitative data on visitors, and knowing the difference between these two streams will help you to understand which UX analytics tool to use, and how to use them.
Difference: Quantitative vs. Qualitative UX Analytics
User experience analytics is divided into quantitative and qualitative UX analytics. And when used together, these two approaches to analytics and user experience will help businesses to build up a comprehensive understanding of customer behavior that they can use to make the changes that will make them happy and drive business results forward.
Quantitative UX analytics focuses on numerical data and statistical analysis to measure user behavior objectively while qualitative UX analytics involves gathering subjective insights through methods like user interviews, surveys, and usability testing.
Let's do a flyby of the two:
Quantitative | Qualitative | |
Definition | Measures user data using numbers and stats. | Gathers insights through observations and interviews. |
Focus | Quantifiable metrics (e.g., rates, times). | User behavior, attitudes, and preferences. |
Data Collection | Surveys, A/B testing, analytics tools. | Interviews, tests, user observations. |
Analysis | Identifies patterns from statistical analysis. | Interprets qualitative data for insights. |
Advantages | Objective decision making, hypothesis testing. | Better understanding of user needs, finding issues. |
Limitations | Lacks context and subjective experiences. | Time-consuming, subjective and biased findings. |
Quantitative Approaches to UX Analytics
Quantitative approaches in UX analytics revolve around the systematic measurement and analysis of the numerical data related to user interactions. These methods provide objective insights into collective user behavior, allowing businesses to identify patterns, trends, and other data synergies that they can then be used to inform decision making. Quantitative approaches are particularly valuable for tracking performance metrics, conducting A/B testing, and optimizing digital experiences based on data-driven insights.
A/B Testing
A/B testing, also known as split testing, involves comparing two or more versions of a digital asset to determine which performs better in achieving a specific goal. By randomly assigning users to different variants and measuring key metrics, businesses can identify the most effective design, content, or feature set.
Visitor Insights
Website intelligence tools like our own TWIPLA website intelligence platform provide a wealth of quantitative data on website traffic, demographics, and behavior. These tools offer insights into user acquisition, engagement, and conversion rates, enabling businesses to assess the effectiveness of their online presence and optimize performance accordingly.
Webpage Heatmaps
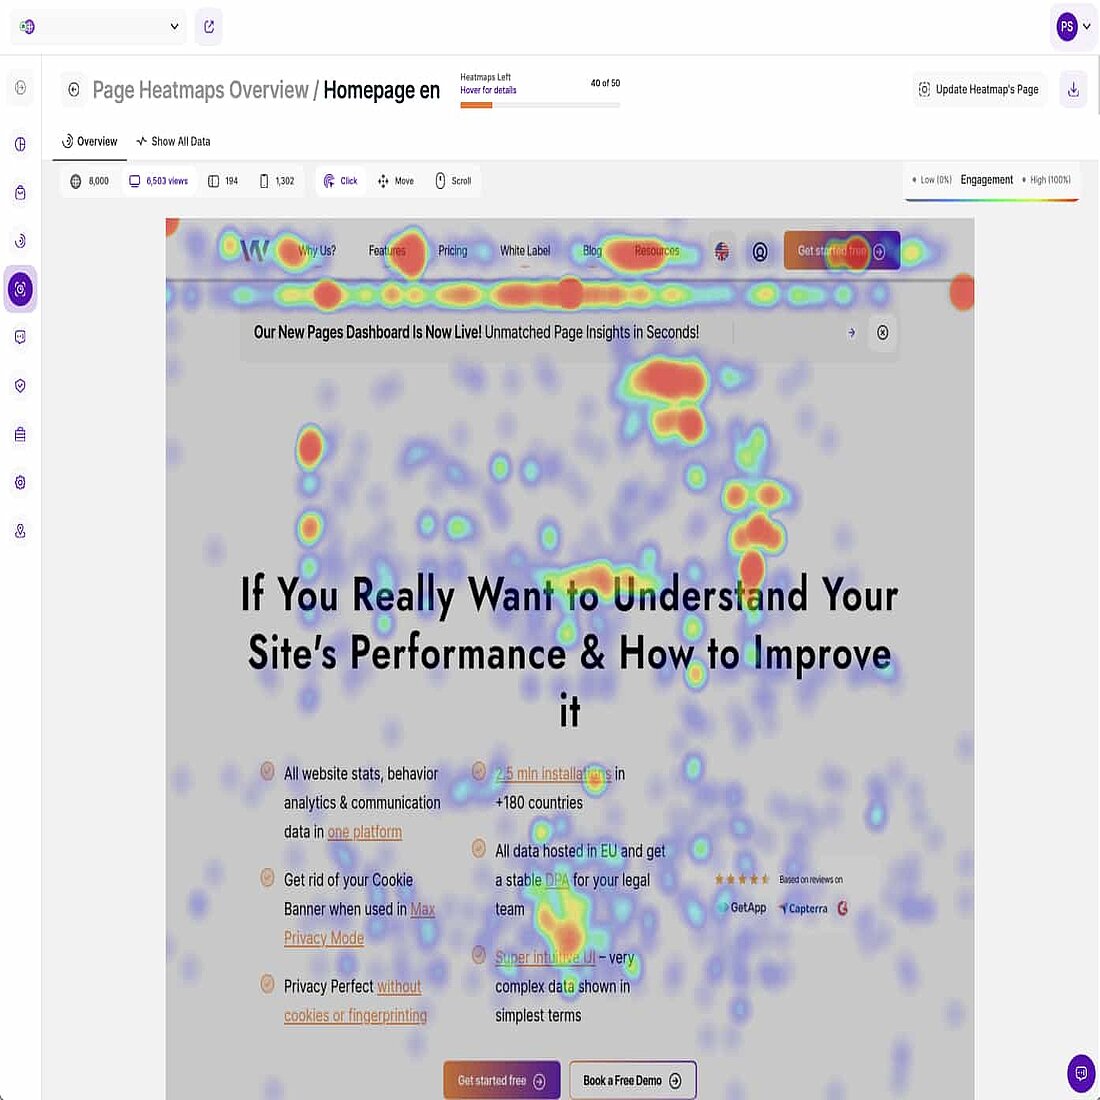
Heatmaps and clickmaps offer visual representations of user interactions, highlighting areas of interest and identifying usability issues. By analyzing heatmaps, businesses can gain insights into user attention, navigation paths, and areas of friction, informing design decisions and optimizing user experience.
Form Interactions
Form analytics tools focus specifically on the analysis of form submissions, providing insights into completion rates, field abandonment, and user errors. By optimizing form design and functionality based on quantitative data, businesses can streamline processes and improve conversion rates.
Quantitative approaches complement qualitative methods by providing a broader understanding of user behavior and performance metrics. By integrating both approaches into their UX analytics strategy, businesses can gain comprehensive insights into the user experience and drive continuous improvement.
Qualitative Approaches to UX Analytics
Qualitative approaches in UX analytics dig into the subjective experiences and perceptions of website visitors. Unlike quantitative methods, which focus on numerical data and statistical analysis, qualitative approaches aim to uncover the 'why' behind user behavior. These methods provide rich insights into the motivations, preferences, and pain points of users, offering a holistic view of the user experience.
Usability Testing
Usability testing stands as one of the cornerstone methods in qualitative UX analytics. By observing users as they interact with a product or service, businesses can identify usability issues, navigation challenges, and areas for improvement. User interviews and focus groups offer additional avenues for gathering qualitative data, allowing businesses to directly engage with users to gain insights into their needs and expectations.
Diary Studies
Diary studies represent another valuable qualitative approach, enabling researchers to capture user experiences over an extended period. By having users document their interactions, thoughts, and emotions, businesses can gain a deeper understanding of how their product or service fits into users' daily lives. These qualitative methods complement quantitative data by providing context and nuance, enriching the overall understanding of the user experience.
Creating an Effective UX Analytics Strategy
Define Your Goal
Clearly outline the objectives of your UX analytics efforts, whether it's improving user engagement, increasing conversions, or enhancing usability.
Know Your Critical Metrics
Identify key performance indicators (KPIs) that align with your goals, such as bounce rate, conversion rate, time on page, and click-through rate.
Select The Optimal Tool
Choose the right tools and technologies to collect and analyze data effectively. Consider factors like ease of use, scalability, and integration capabilities.
Analyze The Data
Utilize advanced analytics techniques to interpret the collected data and extract meaningful insights. Look for patterns, trends, and correlations that can inform decision-making.
Optimize The Process
Continuously refine your UX analytics strategy based on insights gained. Implement iterative improvements to enhance user experience and drive business outcomes.
Top 5 User Experience Analytics Tools
1. TWIPLA
Privacy-Perfect User Experience Analytics
TWIPLA Pricing: TWIPLA has a free-forever option that includes all our behavioral monitoring tools, but businesses with high website traffic numbers should go with a paid plan. These start at $10.39 monthly and go up to $31.99, though we can also create custom plans for enterprises on request.
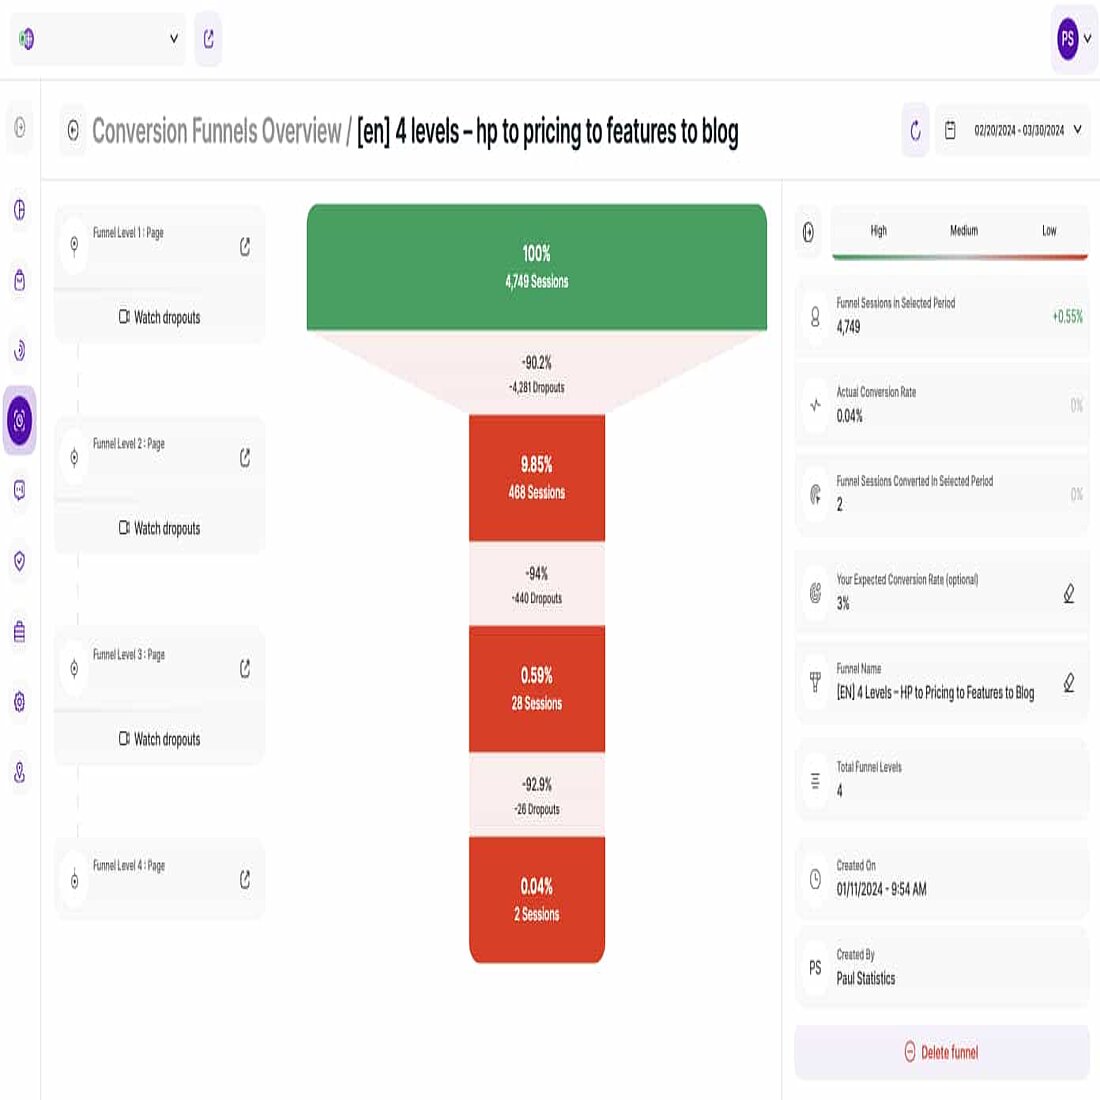
About TWIPLA: TWIPLA is the only complete website intelligence platform on the market and includes every UX tool imaginable. Think heatmaps, conversion funnels, event tracking, and session recordings. These visualizations make complex user behavior data easy to understand, and when used together they can reveal fascinating data synergies that will remain hidden from other platforms that lack our level of functionality.
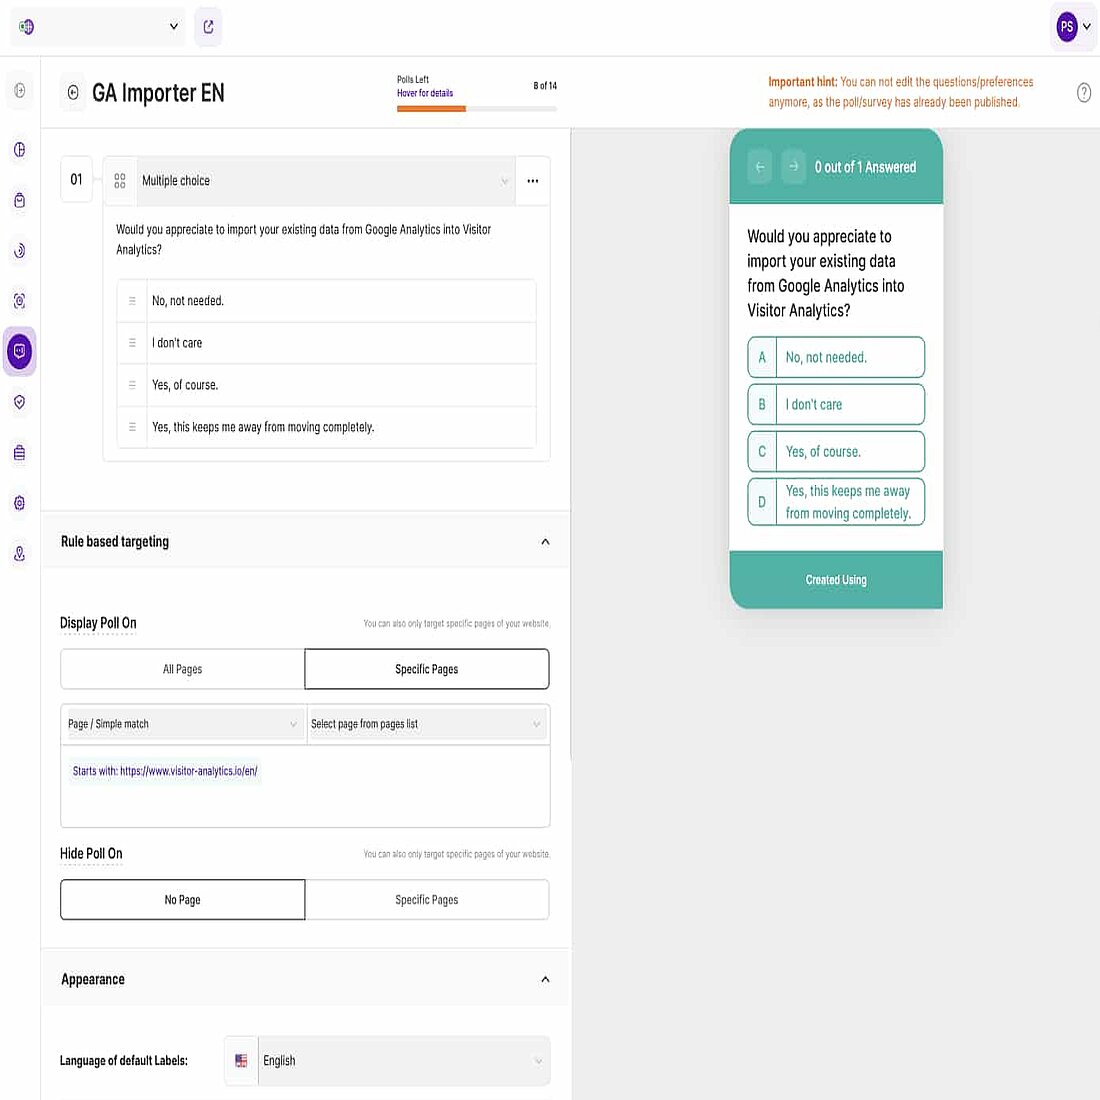
But the platform goes further by also offering complete website statistics and visitor communication options like polls and surveys. These provide further quantitative and qualitative insights and enable businesses to confirm ideas directly with their community.
And taken together, this all means that our platform can act as a central hub for all modern digital optimization activities, and removes the need to pay and learn how to use multiple platforms simultaneously.
Other benefits include:
- Privacy-perfect technology removes compliance responsibilities.
- User friendly interface makes analytics easy for everyone.
- Centralized data management that removes silos.
Learn About the Five Key Analytics Problems Solved by TWIPLA
2. Hotjar
Website Heatmaps & UX Analytics Tools
Hotjar Pricing: With six subscription levels, Hotjar has a pricing point to suit any business and all plans come with a 15-day free trial period. Prices start at €39 per month for their Plus plan and go up to €213 for their Scale plan, though businesses can save money by paying annually.
Hotjar Review: Hotjar sells itself as one of the few all-in-one user experience analytics tools that businesses can use to understand and empathize with their customer's online behavior.
They give off a very human vibe, and it's probably one of the most well known options on the market today.
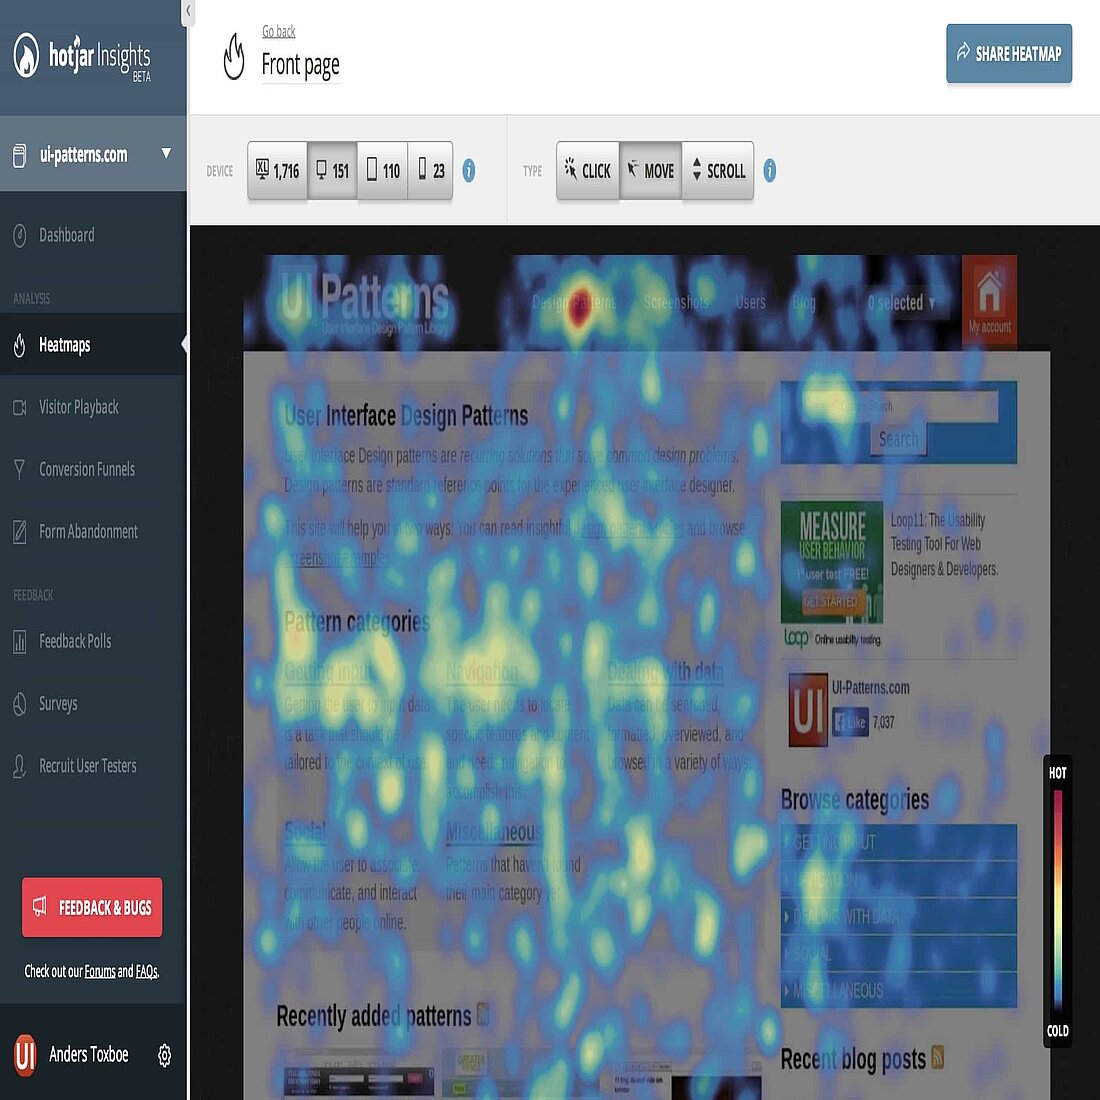
Hotjar is pretty famous for its heatmaps and session recordings, and the quality of these tools somewhat makes up for the lack of predictive analytics, ROI tracking, and customer segmentation.
Other benefits of Hotjar include:
- Customer feedback integrated into UX analytics.
- Extremely user friendly and easy to set up.
- Collected data is incredibly easy to interpret.
3. UXCam
UX Analytics for Mobile Apps
UXCam Pricing: Businesses can choose from three pricing options - Free, Growth, and Enterprise, with each coming with a free 14-day trial. Prices depend on session and video numbers but the exact figures are not publically available; instead, they prefer to speak directly with prospective clients to tailor plans to their needs.
UXCam Review: UXCam is a cloud-based user experience solution. Designed for analyzing mobile apps, it distinguishes itself in a crowded market with a range of visual and intuitive analytics tools.
These are all fantastic even if users complain about the integration complexity, lack of customization options, and sheer data overload that makes finding key insights difficult.
Other benefits of UXCam include:
- Provides visual UX insights that are easy to understand.
- Intuitive automatic event tracking functionality that is lacking from many alternatives.
- Extremely helpful and responsive customer support team.
4. Glassbox
Digital Customer Experience Analytics
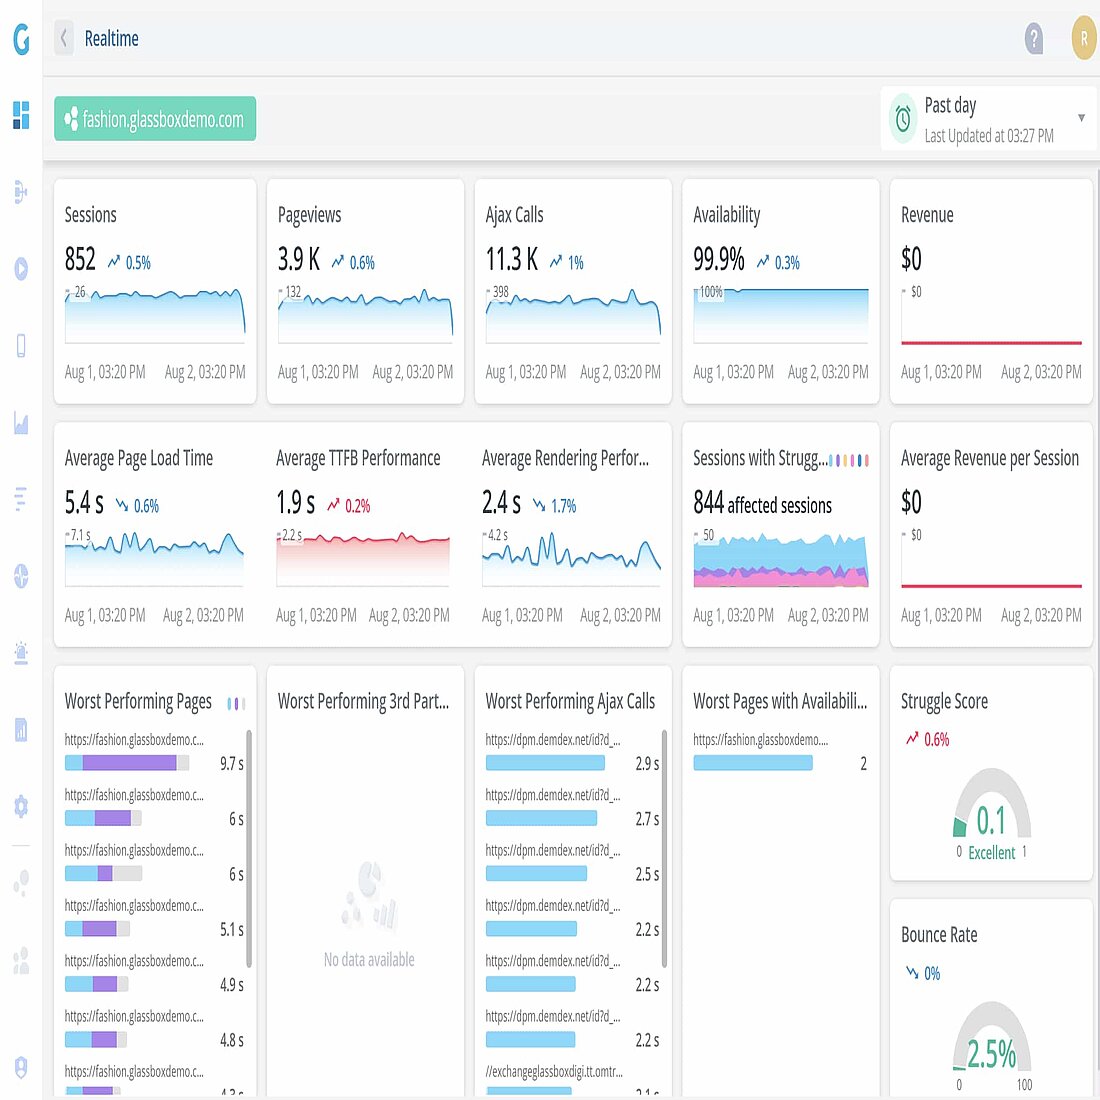
Glassbox Pricing: Glassbox doesn't make subscription levels publicly available but pricing is based on session volumes and starts at $15,000 annually. This makes them one of the more expensive UX analytics options on the market, and they don't offer a free trial or freemium package.
Glassbox Review: Glassbox is a cloud-based web analytics solution, with features that include session replays, heatmaps, website statistics, and Voice of Customer - its own customer support optimization tool.
It was named a Top 100 Software Product in G2's 2024 Best Software Awards, meaning that it's a top choice for larger businesses despite the steep learning curve and slight inaccuracy of data.
Other benefits of Glassbox include:
- Real-time data capture with no tagging required.
- Exceptional session recordings integrated into statistical insights.
- Strong guidance for debugging and optimizing site performance.
5. Mouseflow
Behavior Analytics for Optimal Site UX
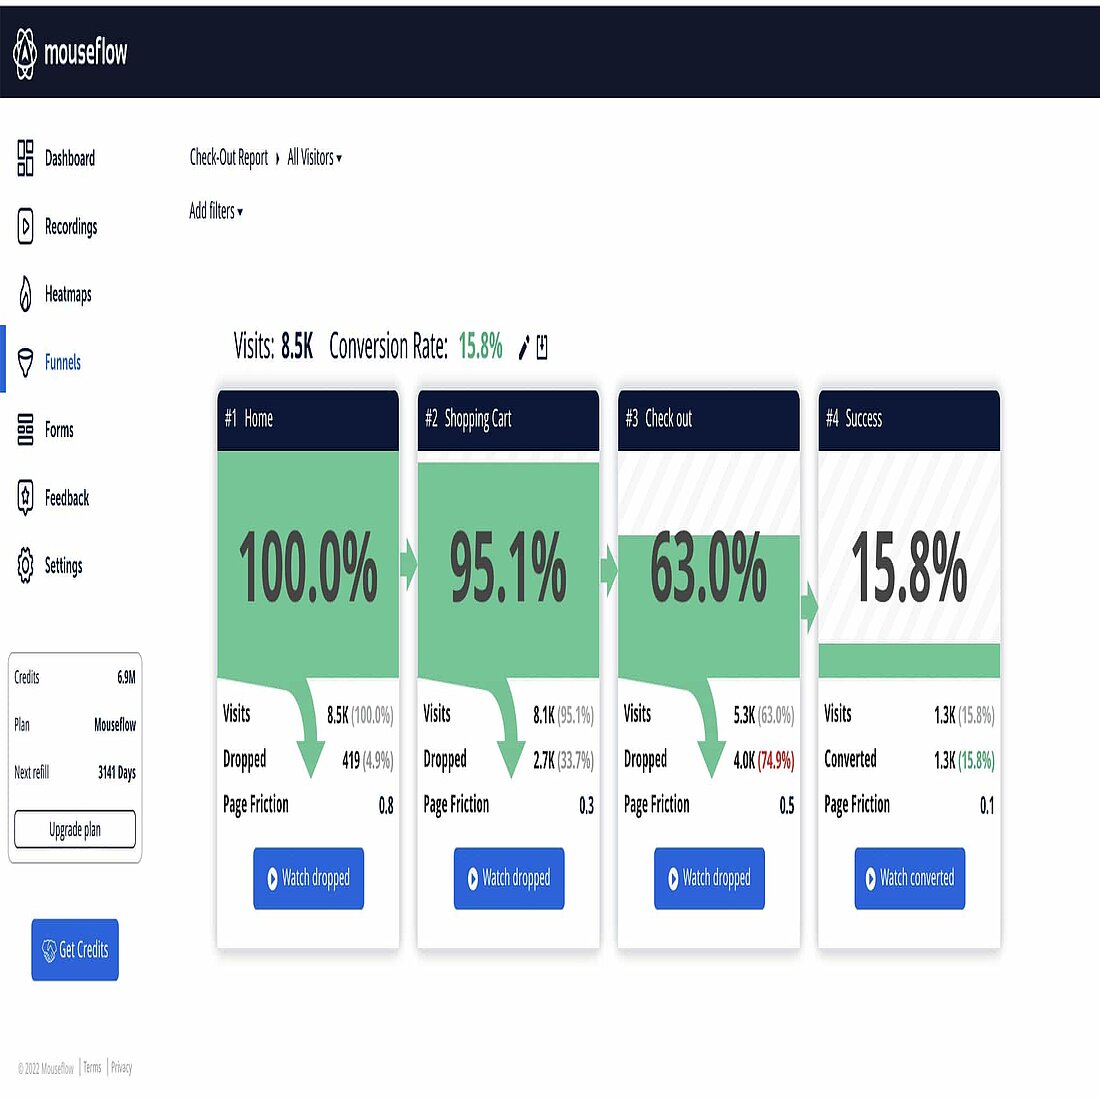
Mouseflow Pricing: Mouseflow has a free forever plan alongside three paid options. These start at $24 per month and go up to $299 for the Pro option. They also offer an Enterprise plan that is fully customizable for big businesses.
Mouseflow Review: Mouseflow is a web-based analytics platform that is used by nearly 200,000 digital marketers. It has a fantastic heatmap tool that is let down slightly by clunky session recording functionality, but it's still a great choice for intuitive UX analytics insights.
Other benefits of Mouseflow include:
- Excels at customer journey analytics
- Effective for increasing form conversions
- Robust data filtering system with no sampling
Adopt Privacy-Perfect Analytics
Our advanced website intelligence solution will enable anyone to grow their website quickly, while protecting visitor data rights and driving up their ESG rating. Sign up for free today, remove your ugly cookie banner, and supercharge data collection!
GET STARTED
That's User Experience Analytics Explained!
And that's it, that's our introduction to user experience and analytics for UX. User experience is a vital consideration for website development, with many businesses seeing it as the keystone that underpins sales, signups, and wider business success.
We're UX experts here at TWIPLA and have developed an impressive privacy-perfect package that anyone can use as an all-in-one guide to UX optimization.
If you want to learn what our website intelligence platform can do for your business, then why not book a product demo or sign up for free and get a feel for it yourself?
But regardless of which platform you choose, happy analytics!
Share article
Get Started for Free
Gain World-Class Insights & Offer Innovative Privacy & Security


