- Why Us?
- Features
White Label
For SaaS Platforms & Agencies
Provide our complete analytics suite to your clients, directly within your own interface and with your/their own branding. Discover Analytics-as-a-Service and White Label Analytics. Great benefit, minimal effort.
- Pricing
- White Label
- Blog
- Chatbots, Assistants & AI Search: Tracking AI-Driven Website Traffic
- Use Case: Using TWIPLA’s Conversion Funnels to Uncover Onboarding Friction
- Website Intelligence News Roundup February 2025
- Website Intelligence News Roundup January 2025
- Alarming Behavior Tracking: Dead Clicks, Rage Clicks and More
- Data Management Strategy: Steps + Insights from Aleksejs Plotnikovs
- Craft a Successful Data Analytics Strategy in 6 Steps
- Interview: Aaron Weller on AI Privacy Challenges
- ResourcesExpand Your KnowledgeGetting Started
Website Intelligence News Roundup March 2024

March is the beginning of spring and it's been an invigorating time here at TWIPLA.
We've deployed a complete revamp of our UTM Campaigns module, with an improved design and better data segmentation capabilities. There's also new buttons, visualizations, and filtering options across the platform, and we'll run through all the main changes since February here.
Away from the platform, we also found time to publish a whole host of tutorial videos, user guides, blogs, and success stories. So scroll on to catch up with all things web intelligence!
What's Inside
New Website Intelligence Resources
- New TWIPLA Tutorial Videos on YouTube
- Feature Guide: How to Get Started With TWIPLA
- Success Story: Gomag and TWIPLA
- Blog: Five Web Analytics Problems Solved by TWIPLA
- Blog: Enterprise Analytics and Boosting Digital Data Efficiency for Big Businesses
Platform Updates
- UTM Campaigns: Redesigned User Interface
- Main Dashboards: Multi-URL Filtering
- Visualizations: More Line Diagram Options
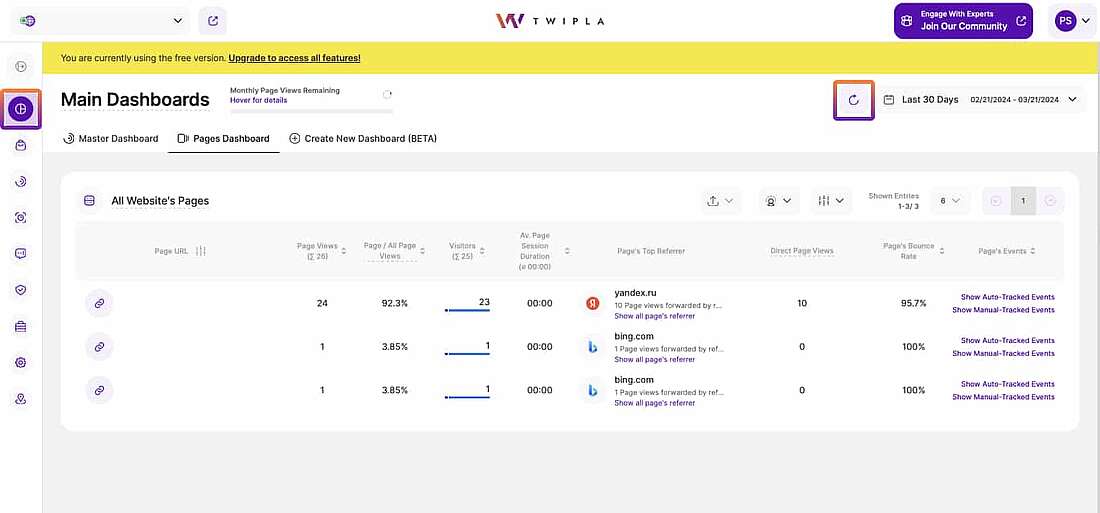
- Pages Dashboard: New Data-Refresh Button
- Website Settings: Google Analytics Data Importer Resurrected
- Other Platform Updates You Might Have Missed
In-House Activity
Click on one of the links above to drop straight down to what interests you or keep scrolling down through the website intelligence news roundup (March 2024).
New Web Intelligence Resources
New TWIPLA Tutorial Videos
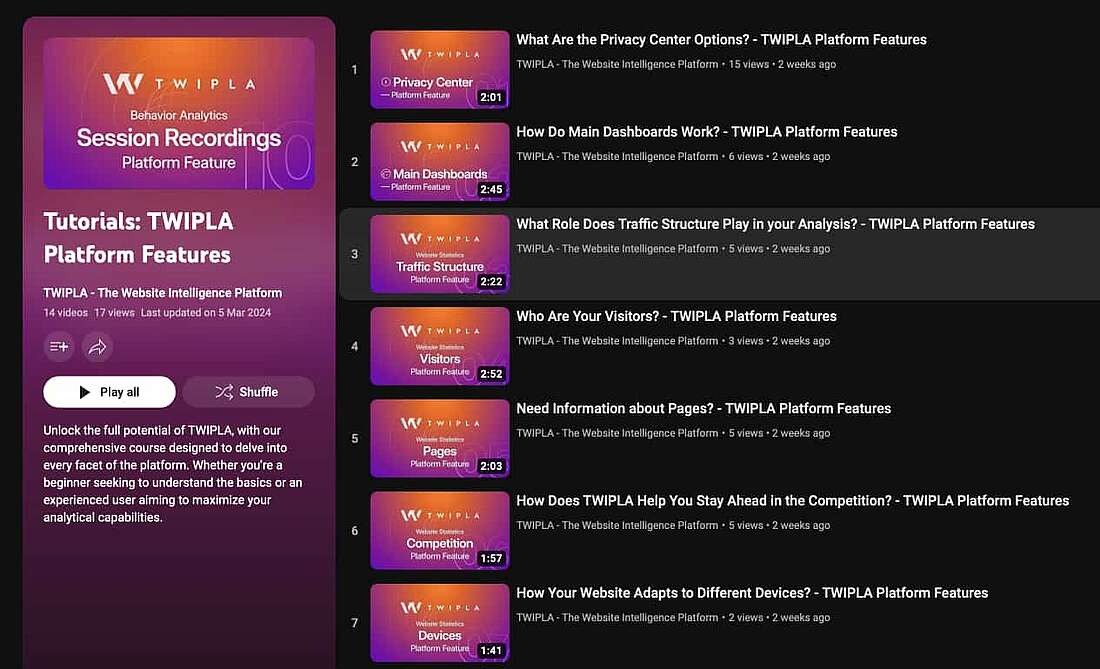
Away from the development team, March has been all about increasing the training resources available to users. We've published 14 tutorial videos on YouTube, with each introducing one of our main features and giving some advice for finding them, using them, and getting the results you need.
There's still a way to go. We'll be uploading many more videos to YouTube over the next few months, so subscribe to our YouTube account so that you don't miss a thing. And of course, feel free to contact customer support if there's a particular feature or goal that you're having trouble with, and we will jump that content to the front of the queue!
We're always looking for new ways to help users get the most out of our platform. There's our Support Center that we work to keep synced with updates, the reponsive customer support team, and management with little patience for software that isn't easy to use.
There's also these feature guides that we're publishing to help users get up to speed and reaching goals as quickly as possible. This is the second in the series; in it, you’ll find all the information you need to customize the website intelligence platform to your specifications.
Gomag is a leading European eCommerce store builder, with 4,000 active sellers enjoying a combined turnover of €4 million. They're also a key TWIPLA partner, and were invaluable during the development of our eCommerce Statistics toolkit.
We’ve published a success story that looks into our history together. It runs through how they are using our White Label for SaaS Platfoms service to provide their webstore users with anlytics as a native integration - check it out if you want to keep up with our growing group of partners.
Website analytics platforms are much easier to use than when they first arrived twenty-odd years ago, with ever-advancing dashboards, interfaces, and data compatibility. It makes sense; this software has needed to keep up with the furious pace of web technological development to stay useful.
And at TWIPLA, we've pulled the analytics sector into the Web 3.0 era. As an all-in-one data management and website intelligence solution, our platform has made many frustrating analytics problems obsolete, while enabling users to dig deeper into their data than ever.
Entreprise analytics refers to the difficult task that big businesses have when it comes to pulling all their data together for analysis. The reward is there, but rigid processes and corporate politics make it hard to maximize the potency of datasets.
IT setup is also decisive when it comes to pulling these different data sources together to be analyzed holistically. This blog explains how big businesses can leverage enterprise analytics effectively, and introduces some of the top software for this work.
Read the Blog: Boosting Digital Data Efficiency for Big Businesses With Enterprise Analytics
In-House Activity
TWIPLA @ CloudFest 2024
About CloudFest: It's the world's largest internet infrastructure event. Now in its 20th year, the conferences pulls all the main players, thought leaders, and enthusiasts together. And for this anniversary edition, the organizers took over a beautiful European amusement park.
Dragos and Alex, our Head of Integrations and CEO respectively, have just got back from an exciting Cloudfest 2024. They discussed our white label website intelligence solution, and left a trail of new connections behind with extensive partnership opportunities!
And with more speakers and participants than you can shake a poloroid at, it was a fun few days for them despite the much-promised purple and orange suits not materializing. Bring on Cloudfest 2025!
Stay tuned for some exciting new content that will help you get even more from your analytics! We'll soon be publishing video interviews, podcasts, and survey results from our global community of website intelligence users. Sign into the Community Portal to participate in discussions or watch the LinkedIn clips to see what you miss.
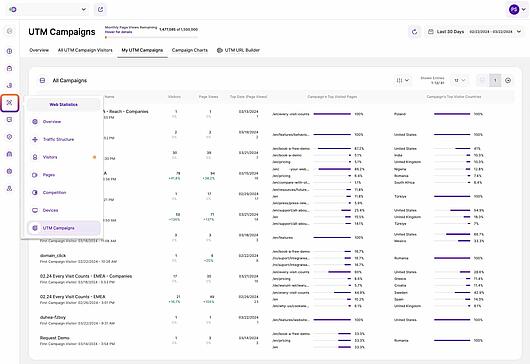
UTM Campaigns offers a simple way to analyze the performance of campaign-specific output collectively. The module’s reports can be used to for campaign planning, resource allocation, and ROI benchmarking. It's vital for monitoring the performance of related output simultaneously, but the user interface needed a facelift.
That’s now been deployed for all technical environments, and you'll notice some big changes to the layout of the different submodules, as well as some additional data synergy possibilities and insights on display. These include:
My UTM Campaigns
We've added two new table columns - Top Three Visited Pages and Top Three Visitor Countries. This adds further depth to the displayed data combinations, and makes it easier to compare the performance of any campaigns around these key datapoints.
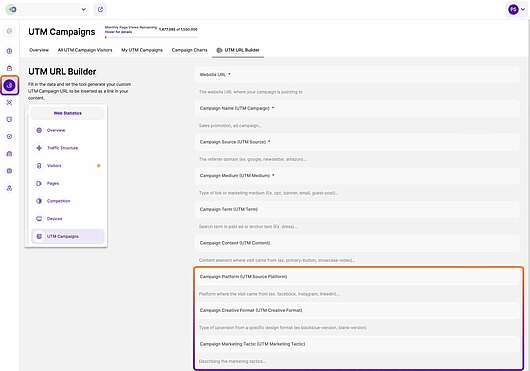
UTM URL Builder
This tool now has three additional input fields - Platform, Creative Format, and Marketing Tactic. They're optional, but use them when you need to increase the segmentation possibilites of campaign performance reports.
Main Dashboards: Multi-URL Filtering
Users can now activate multiple page URLs simultaneously, a blindspot that's been playing on us here in the office for a while. It's something that seems easy to fix if you're not analytics developers, but it actually forced us to go deep into the analytics cluster to create these new data relationships.
This new functionality has now been deployed and we're sure you'll find it useful. The capacity to analyze multiple page URLs in the same report block opens up many exciting new data combination possibilities for analysis, and also makes it much easier to build Custom Dashboards for analyzing related content together.
Visualizations: More Line Diagram Options
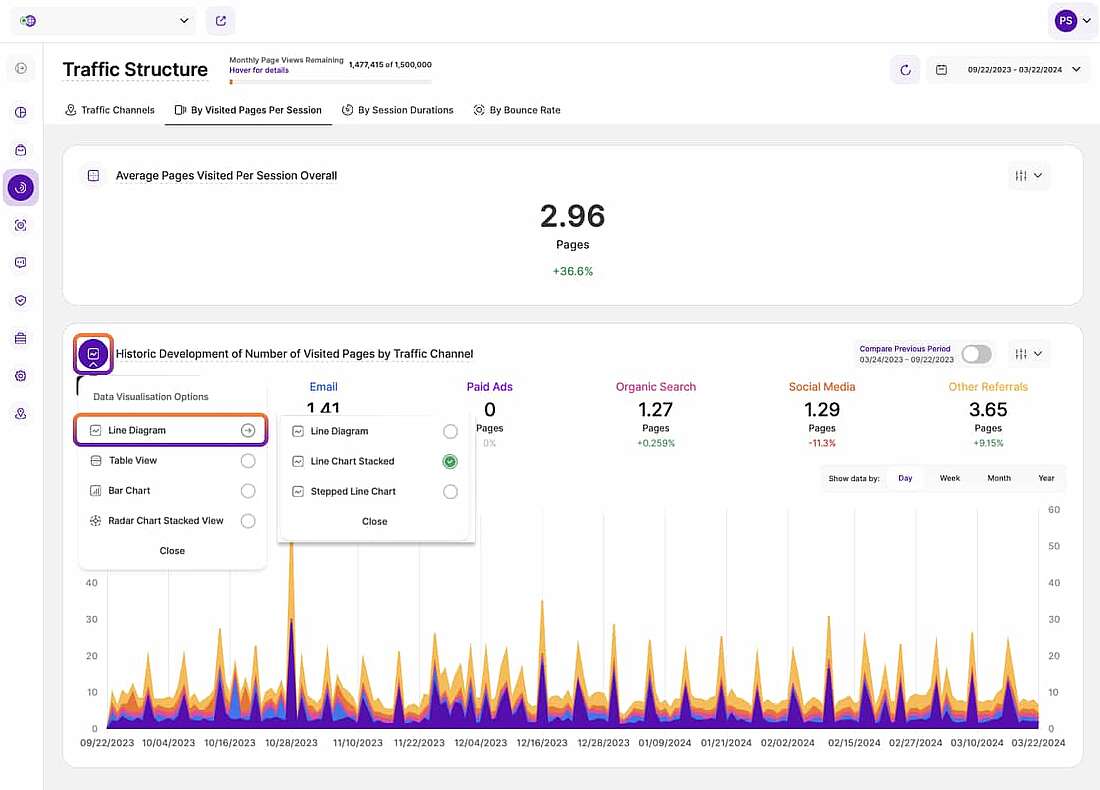
The last month has seen our data visualization options go from strength to strength. Users are now able to switch between a standard line diagram, a stacked line diagram, and a stepped line chart. And with the table, bar chart, and stacked radar views, it's all now just a little more fun for the visual thinkers.
These new line diagram visualizations were intially introduced to the Main Dashboards at the beginning of March, but have since been rolled out across the Traffic Structure and eCommerce Statistics modules.
Try them out when you get a chance. These three options serve different slightly data types, but you may well find that one of them is more compatible with the way your mind works.
The Pages Dashboard has a prominent new data refresh button, located in the top right of the TWIPLA interface (next to the data range selector). And with this new addition, users no londer need to reload the app to get their up-to-the-second reports on page performance.
This makes everything just a little bit more seamless, and stops the resetting of filters that frustrated users in the past when they tried to refresh data. Try it out, it's particularly useful when you need to react quickly to the more time-sensitive elements of marketing.
Website Settings: Google Analytics Data Importer Resurrected
If you used Google Analytics in the past, then you'll want to bring all your historic website data into one place. TWIPLA's privacy-perfect data management system and extensive website intelligence toolkit makes our platform an ideal central hub. But out Data Importer had been out of service while we worked on some compatibility bottlenecks.
Those have now been resolved, making it high time you fueled TWIPLA with the additional data that will make our website intelligence even more useful. And don't forget, you can easily also export all your TWIPLA data if you ever want to analyze it elsewhere.
Other Updates You Might Have Missed
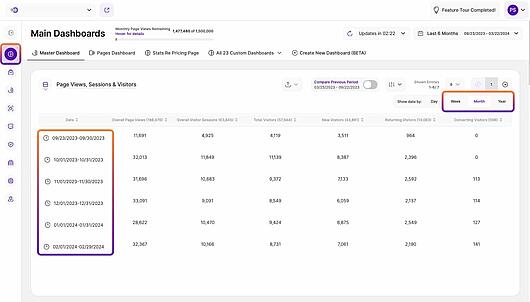
Labeling: Time Range Display Changes
The date range labels have been updated. They now show both the start and end date, making data easier to understand.
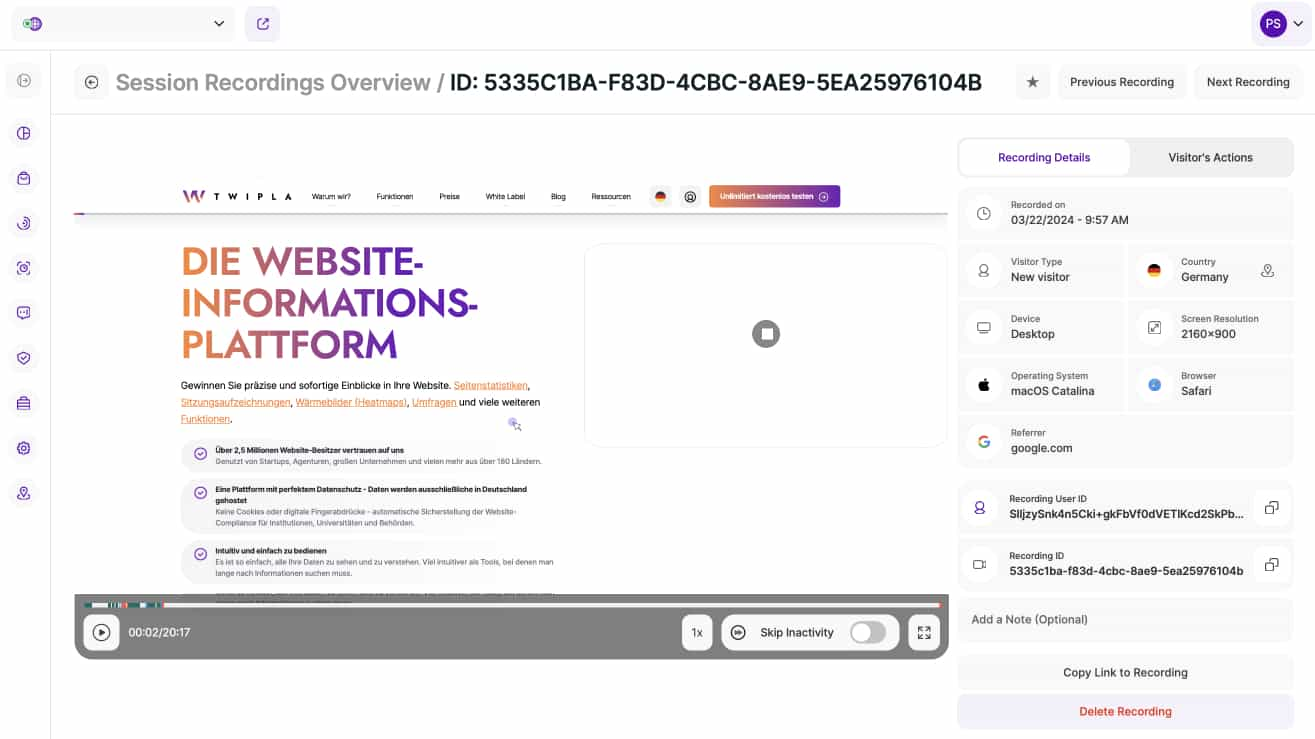
Session Recordings: Performance Boost
While everything looks the same, we've made some improvements to functionality, and you'll find it all just works better.
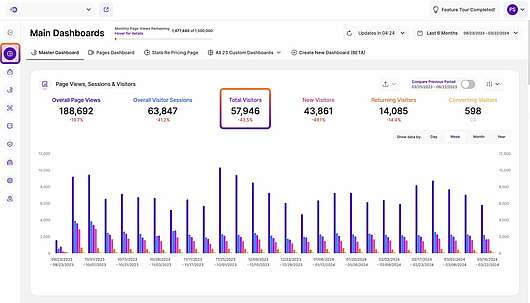
Dashboards: New KPI - Total Visitors
"Total Visitors" was hidden in Web Statistics Overview, but we've added it to the first Master Dashboard report block to give it the emphasis it deserves.
Auto-Tracked Events: Preview Mode
We've deployed several updates. There's a new loading modal, and a retry button that acts as a workaround for users having compatibility issues when they want a preview of any event for reference.
That's All Our News from March 2024
That's it, that's the big things that we've been focusing on here at TWIPLA since February. And with many more backend and frontend developments nearing completion, the next website intelligence newsetter will make an exciting read for analytics and privacy enthusiasts.
If you don't want to miss this handy summary of our monthly activities, then sign up to our newsletter and receive it straight to your inbox.
Until next month, happy analytics.
Share article
Get Started for Free
Gain World-Class Insights & Offer Innovative Privacy & Security

You might also like
Website Intelligence News Roundup February 2024 27 February 2024 - by Simon Coulthard
Website Intelligence News Roundup January 2024 12 January 2024 - by Simon Coulthard
Website Intelligence News Roundup December 2023 15 December 2023 - by Simon Coulthard


