- Why Us?
- Features
White Label
For SaaS Platforms & Agencies
Provide our complete analytics suite to your clients, directly within your own interface and with your/their own branding. Discover Analytics-as-a-Service and White Label Analytics. Great benefit, minimal effort.
- Pricing
- White Label
- Success Stories
- ResourcesGetting Started
CONTENTS
- 1. Install TWIPLA & Verify It's Working
- 2. Explore the Master Dashboard
- 3. Set Your Privacy Mode & Preferences
- 4. Dive Deeper into Your Website Statistics
- 5. Play with Session Replays & Heatmaps
- 6. Check Your Website Usability Score
- 7. Set Up Event Tracking & Funnels
- 8. Start a Conversation with Your Visitors
- 9. Customize Your Reporting and Alerts
- 10. Calibrate eCommerce Statistics (If You Sell Online)
- What’s Next?
How to Get Started with TWIPLA

First things first: welcome to TWIPLA.
If you’ve just signed up, you’re now part of a global community of site owners, marketers, and data-driven thinkers working to understand their visitors and grow smarter online.
Getting started with TWIPLA doesn’t take long, but having a clear path makes all the difference.
This guide will walk you through the key steps to get your tracking up, your settings right, and your insights flowing from your first visit to deep behavioral analytics.
And if you need a hand along the way, you’ll find links throughout to the right parts of the Support Center.
1. Install TWIPLA & Verify It's Working
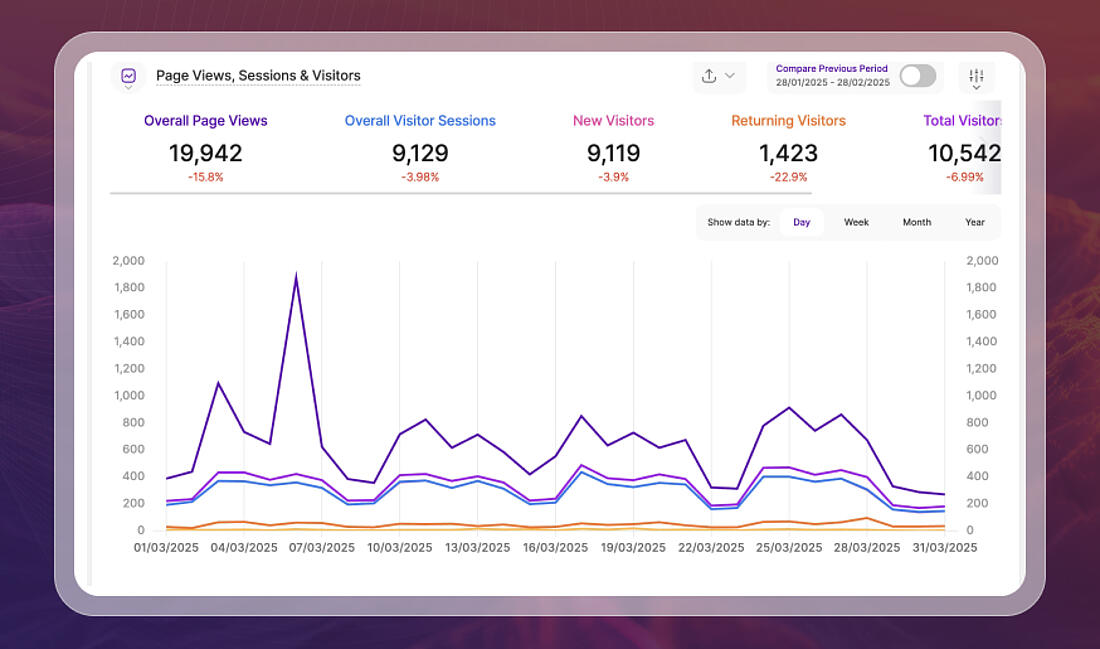
Getting started with TWIPLA is refreshingly quick.
Whether you're using a website builder or a custom domain, the platform has integration options to match any technical environment.
Once installed, sign into TWIPLA.
You’ll know TWIPLA is working when you see the first activity trickle in, which will usually be yourself if your website is also new.
For instance in the Master Dashboard, you'll see data appear in the following report blocks:
- Page Views, Sessions & Visitors
- Page Views Overall on the Top 6 Pages
- Bounce Rate
- Top Visiting Countries
- Live Visitors
If nothing shows up after a couple of minutes, double-check your tracking code installation to ensure that TWIPLA is firing on all cylinders.
Tip: Use the Ignore (Own) Visits feature to block your IP. That way, your data won’t get skewed every time you check anything.
2. Explore the Master Dashboard
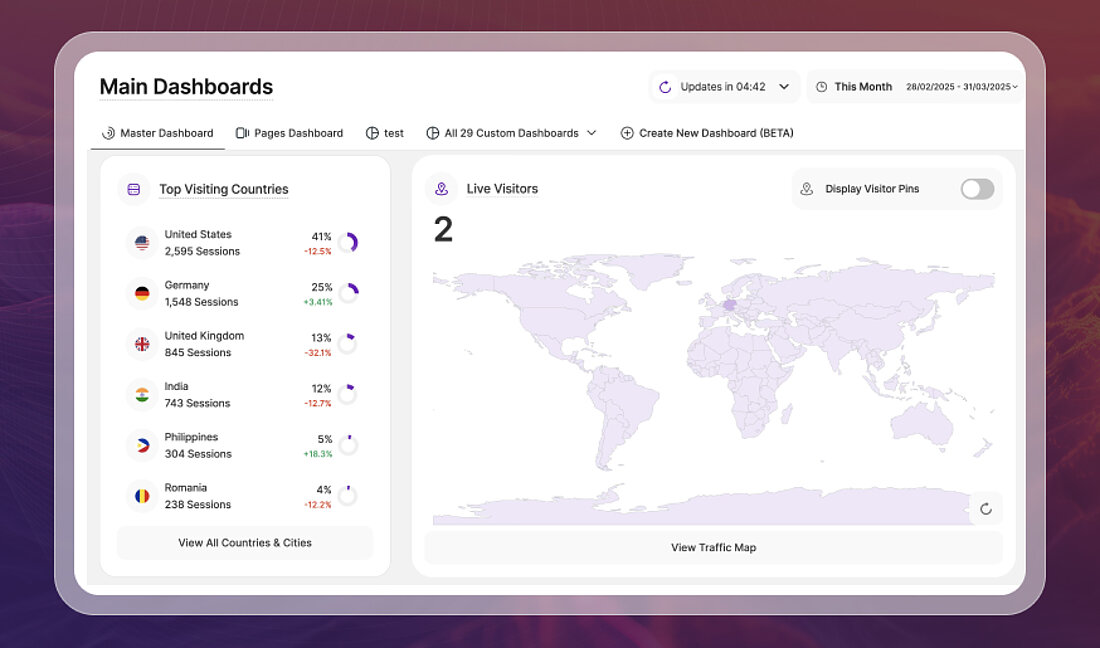
The Master Dashboard is the first thing you’ll see when you log in, and it gives you a live snapshot of everything happening on your website as it happens.
From an overview of your latest visitors to alarming behavior events, bounce rate, and top referrers, each report block provides high-level insights drawn from TWIPLA’s 42+ website intelligence tools.
You can also use the Master Dashboard as a jumping-off point for deeper research, since clicking into any report block takes you directly to the related module or submodule.
Tip: If you're ever unsure what a block is showing you, just click its title. A help box will appear with a plain-language explanation, glossary link, and support resources.
3. Set Your Privacy Mode & Preferences
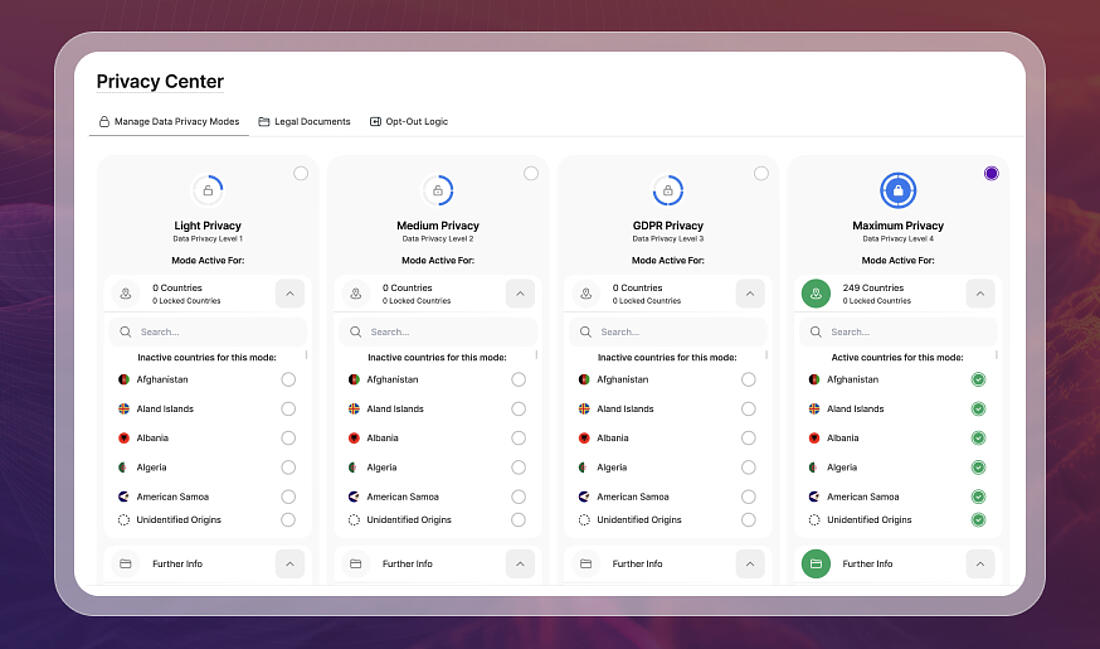
If you followed the onboarding sequence properly, you’ll have already chosen your privacy mode when you connected your first site.
But nothing’s set in stone. You can return to your privacy settings anytime to adapt to new legal requirements or shift your strategy around visitor consent.
TWIPLA offers four privacy modes, designed to meet different compliance standards. You can also use Custom Country Data to further tailor your setup by country of origin, so that our platform automatically adapts data collection based on where a visitor is located, and the laws that protect their online privacy.
Tip: Our platform includes a second tracking code that you can use to maximize privacy-compliant data collection and report accuracy.
If TWIPLA is not set entirely to Maximum Privacy Mode and you’re using a cookie consent banner, you can install this second code into the banner’s opt-out button. This will automatically switch tracking to Maximum Privacy Mode for anyone who reject your cookie policy - ensuring that you have data on all your visitors.
4. Dive Deeper into Your Website Statistics
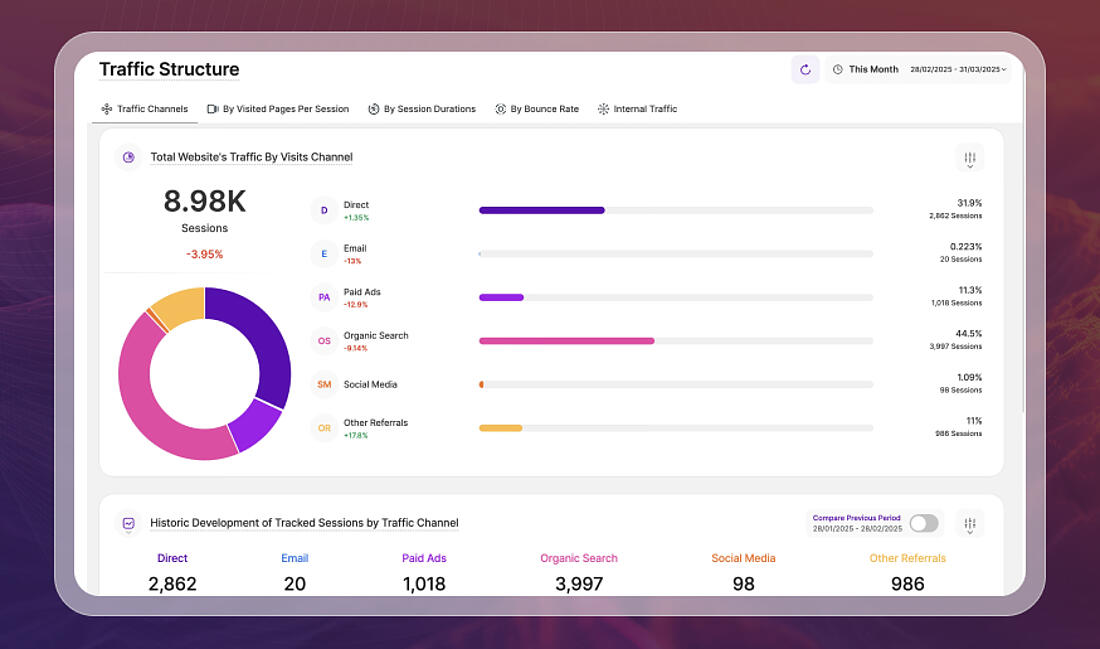
The Master Dashboard gives you a quick overview, but more detailed insights are waiting for you in the different website statistics modules.
This is where you can explore granular data on everything from individual page performance and visitor statistics to traffic sources, UTM campaigns, and where people go after leaving your site.
Each module focuses on a specific area of your website’s performance, complete with graphs, filters, and historical trends that help you understand how your site is doing over time.
If you want to know which devices people use, which pages are converting, or even which companies are paying an interest in your site, this is where to find those answers.
Tip: Start with Visitor Statistics and Traffic Structure. These modules give you an immediate understanding of who your visitors are and how they’re finding your site, making them the best first step for spotting early trends and identifying your most valuable digital channels.
5. Play with Session Replays & Heatmaps
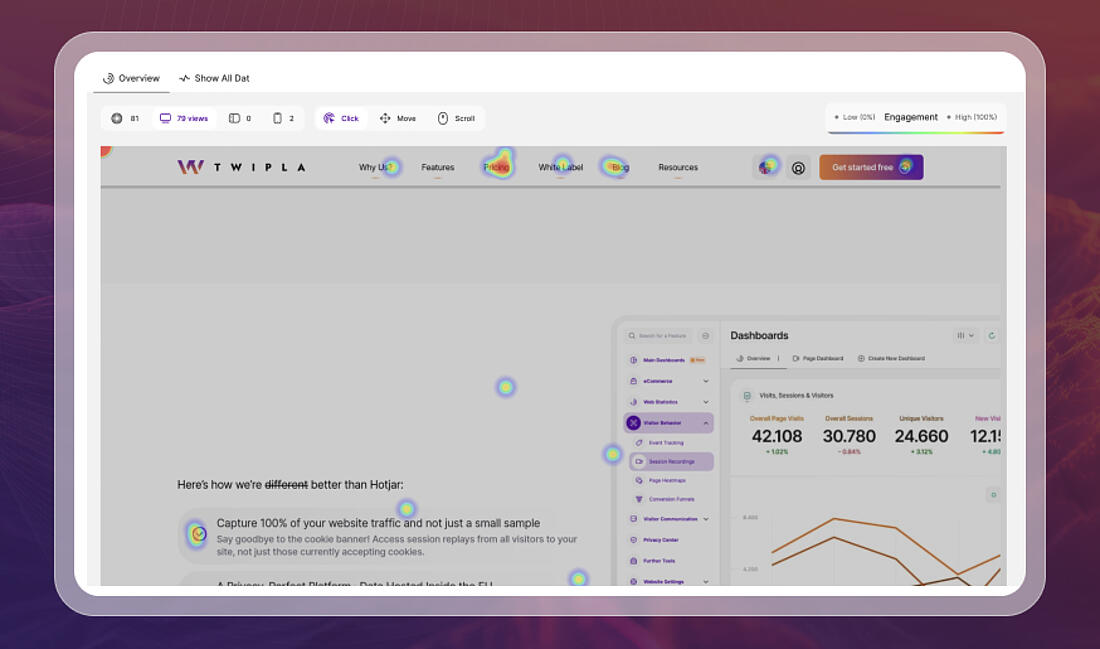
Session recordings and heatmaps are two of TWIPLA's visitor behavior analytics tools, and they really bring your website data to life.
Session recordings are generated videos of browsing sessions that let you watch how individual visitors actually interact with your site. You can see where they scroll, what they click, how long they stay, and where they give up.
Heatmaps turn collective traffic behavior into visual patterns, showing which areas of a page attract the most attention through clicks, movement, and scroll depth.
Together, these tools reveal what traditional metrics cannot. They help you understand what people are really doing and where website issues might be getting in their way.
Tip: Start by watching session recordings and activating heatmaps for key pages like your homepage, product pages, or pricing page. These tools give you direct insight into how visitors interact with important content, helping you spot usability issues, broken elements, or missed revenue opportunities.
6. Check Your Website Usability Score
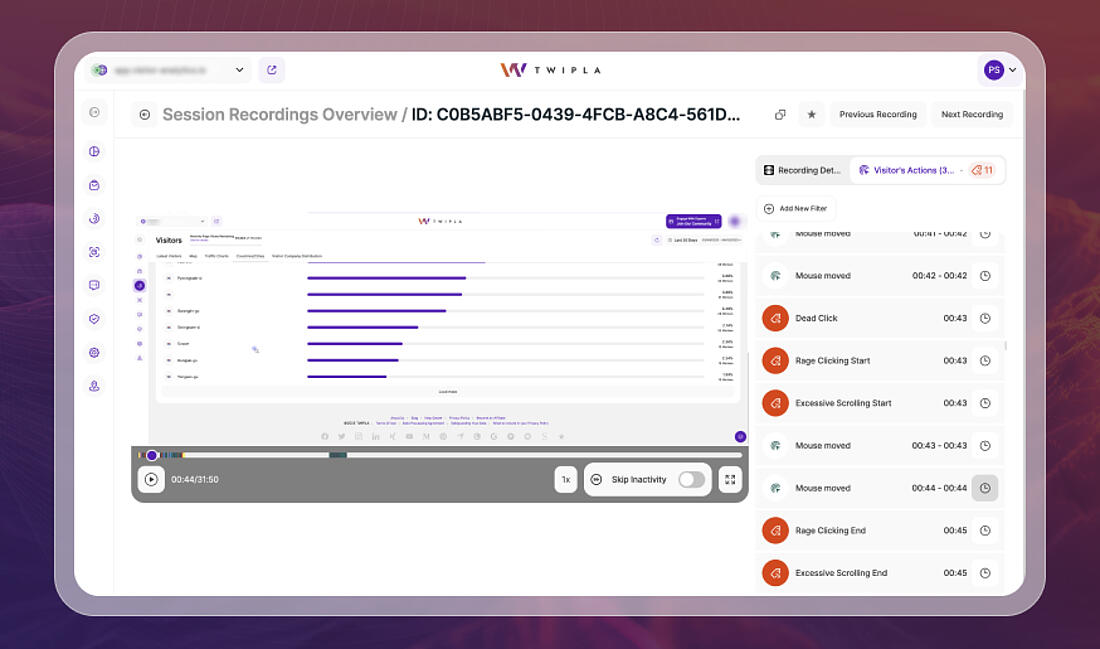
At the very top of the Master Dashboard, you’ll find the Website Usability Score. It’s a live indicator out of 100 that reflects how smoothly your site is working based on real visitor frustration signals.
This score is calculated from six Alarming Behavior Events: dead clicks, rage clicks, U-turns, intensive mouse movement, excessive scrolling, and rapid page reloads. These behaviors often point to broken elements, unclear navigation, or other problems that need attention.
Click into any behavior to explore detailed reports showing which pages are being affected, how often each issue occurs, and how things are trending over time. You can also open a curated list of session recordings where those events took place to see exactly what went wrong and how visitors reacted.
Tip: A single rage click might not seem like much. But clusters of alarming behaviors often highlight real friction points that could be hurting the visitor experience.
7. Set Up Event Tracking & Funnels
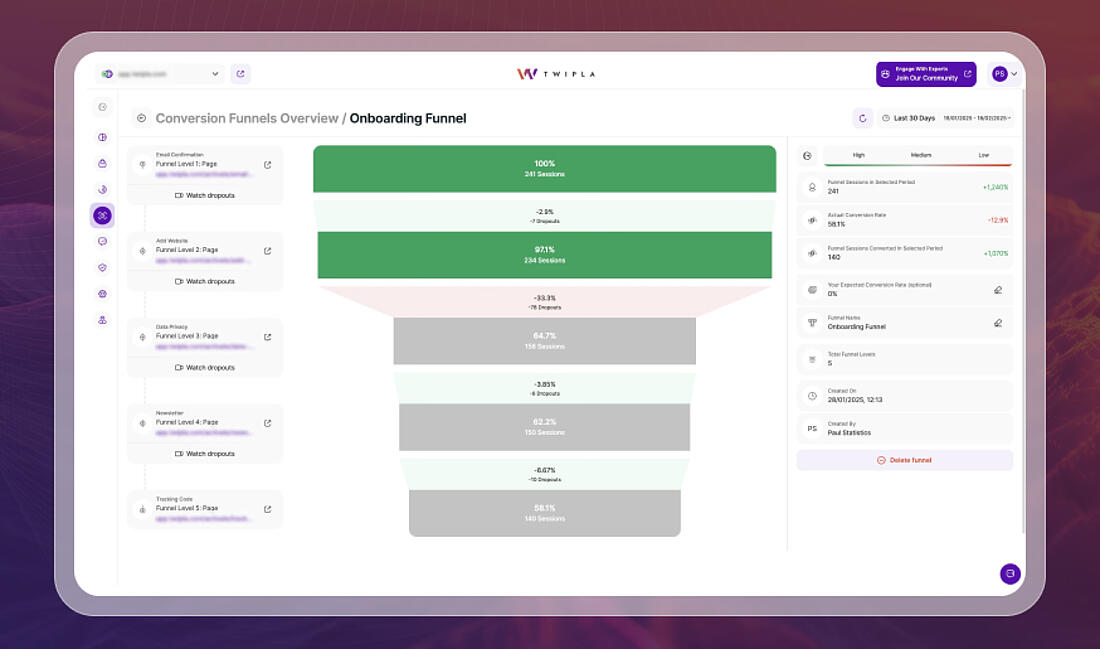
Event tracking and conversion funnels are two more powerful visitor behavior analytics tools, giving you a deeper look into what visitors do on your site and how well your pages are guiding them toward conversion or other actions that are important to you.
With event tracking, you can monitor specific interactions like button clicks, form submissions, video plays, or any other action that you can think of. Many events are tracked automatically, but you can also create your by using the event tag generator.
Conversion funnels let you map out the key pages visitors should move through on their way to converting, like from landing page to product page to checkout. You’ll see how many people make it through each step and where they drop off.
You can even watch session recordings for visitors who exited the funnel to understand exactly what's causing friction in the first place.
Our team recently used conversion funnel analytics to optimize TWIPLA's own onboarding process, and you can learn from that experience in this blog.
Tip: Build your first funnel around a key goal, like getting from landing page to checkout. It’s one of the fastest ways to spot and fix conversion blockers.
8. Start a Conversation with Your Visitors
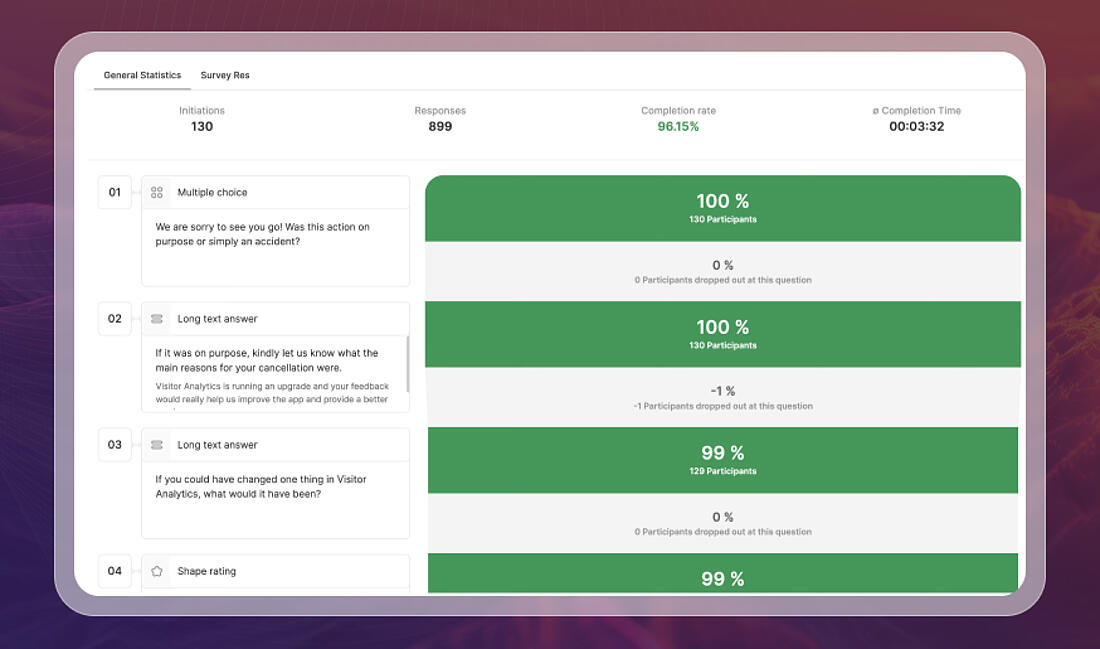
Website analytics shows you what people do, but sometimes the best way to understand visitors is to just ask.
TWIPLA includes built-in tools for visitor communication with polls that appear directly on your site and surveys that open in their own webpage and can be shared via email, social media, or anywhere else.
Use them to find out why visitors didn’t convert, gather feedback on their experience, or ask them anything that's important to your business.
Polls are great for quick, high-response interactions, while surveys are ideal for gathering deeper insights over time. All responses are collected automatically and easy to analyze in your dashboard.
Tip: Trigger a poll on specific pages or actions, and share surveys with segmented audiences to gather focused, high-quality feedback.
9. Customize Your Reporting and Alerts
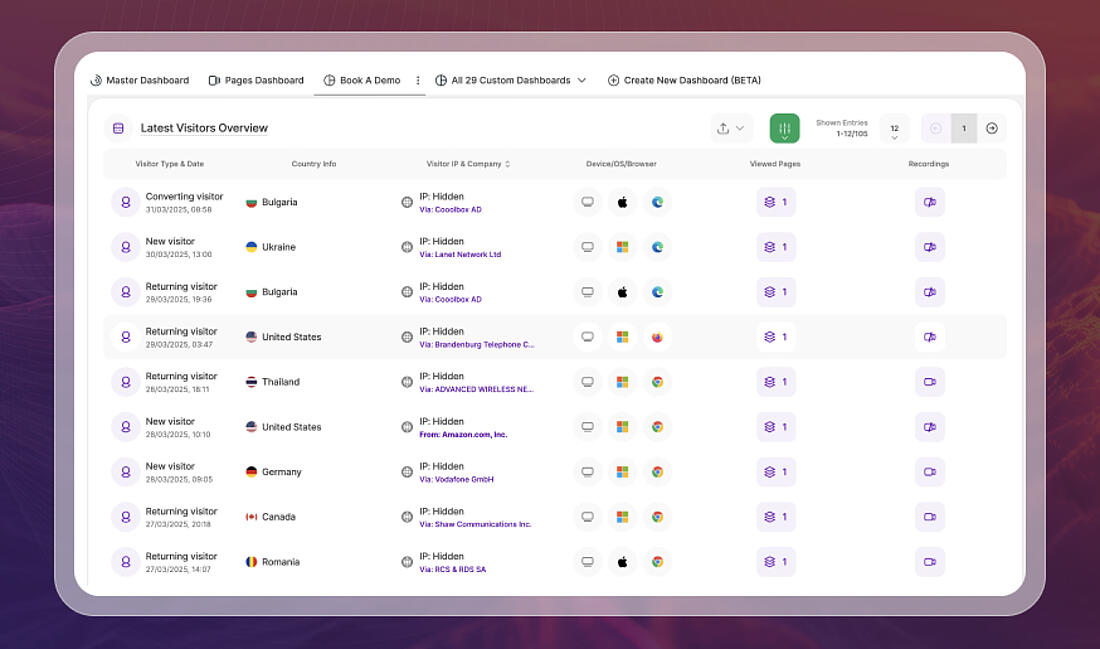
Once you’ve explored the platform, it’s time to tailor how you access insights.
Custom dashboards let you focus on the metrics that matter most. You can drag, drop, and reorder report blocks to match your priorities, or create separate dashboards for different teams and use cases.
You can also schedule automated reports to land in your inbox, giving you regular updates without needing to log in.
And to stay ahead of problems, activate email alerts for alarming behavior events like rage clicks, dead clicks, or excessive scrolling. You can define the threshold and time frame that trigger a report, making sure you're notified when visitor frustration starts to build.
Tip: If you’re working in a team, send behavior alerts and scheduled reports to different emails so everyone stays in the loop with zero effort.
10. Calibrate eCommerce Statistics (If You Sell Online)
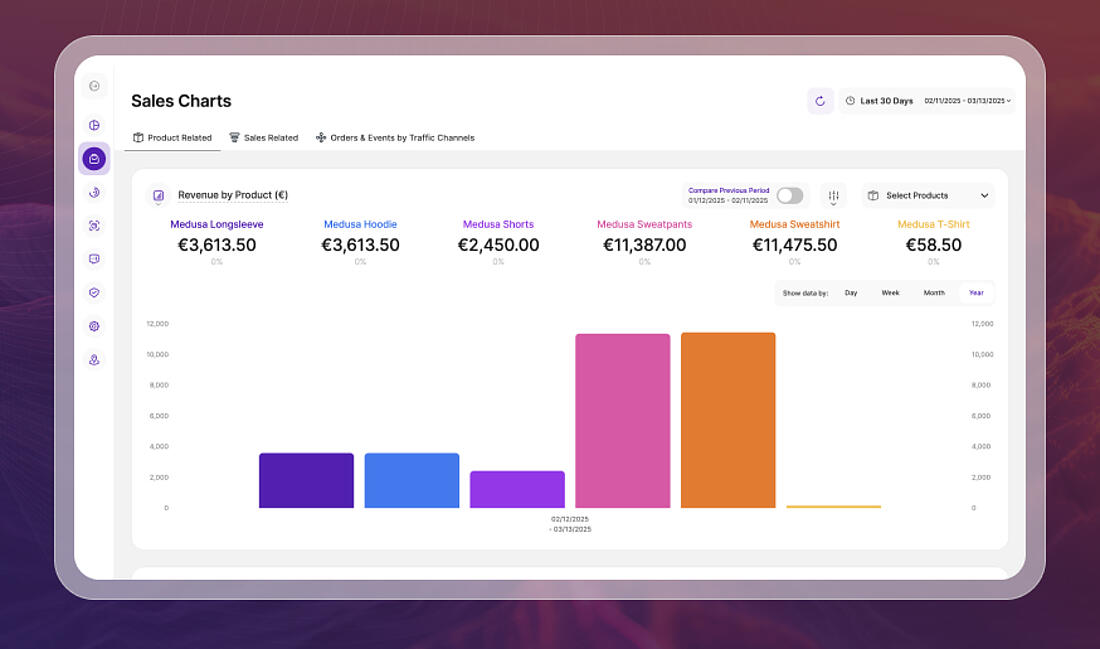
If your site includes an online store, TWIPLA’s eCommerce Statistics module can reveal how products perform, where revenue is generated, and what actions visitors take before they buy.
This feature doesn’t activate by default, so make sure you’ve completed the short setup process so that the module is fed with the data it needs.
Once active, you’ll gain access to detailed KPIs like total revenue, average order value, top-performing products, and cart abandonment trends. These insights make it easier to fine-tune your sales strategy around real customer data.
Tip: Filter your eCommerce stats by product to spot which items drive the most revenue, and use that insight to improve promotions, pricing, or page layouts.
What’s Next?
Now that you’re up and running with TWIPLA, there’s plenty more to explore.
If you want a great example of how a new user quickly enhanced their business with TWIPLA, check out our News Link Live success story.
Also, subscribe to our newsletter to stay updated on new features, platform improvements, and expert insights.
For practical guidance, visit Resources for user guides, FAQs, integration help, and legal documentation or head to the Blog Portal for tips, use cases, and inspiration.
And if you ever need a hand, our Support Center and in-app Help Boxes are always there when you need them.
In the meantime, happy analytics.
Share article
Get Started for Free
Gain World-Class Insights & Offer Innovative Privacy & Security


