
-
Frequently Asked Questions

-
All About Features
- How to Install the Tracking Code
-
User Guides
-
Integrating With Other Platforms
-
Legal, Data Privacy & Certificates
- White Label Analytics
- Glossary
- Affiliate Program
- Contact
Visitor Communication
Receiving Invaluable & Direct Feedback From Your Website Visitors
What It's All About

Our Visitor Communication feature enables you to create "question bubbles" directly integrated into your website or complex questionnaires available on a separate URL within seconds or minutes. You can get direct and real feedback from your website's visitors based on the questions that really haunt you – "How do you like our service?", "Do you find our page easy to navigate?", "Where do you see room for improvement?", etc.. Web Statistics & Visitor Behavior provide you with extremely helpful numbers and stats, however, asking your visitors directly about topics you are interested in and evaluating hundreds or thousands of their replies with ease, is a priceless complementary feature.
Important Hint: The poll display is closely related to the visit tracking event, so visitors ignored within your application settings, will not be able to see the poll. Make sure that your visits are not ignored either, to be visible to you as well.
The Visitor Communication module mainly offers you two different features – polls and surveys. This module is divided into four sections to deliver almost all the information you need about how to connect with your audience:
Some General Hints

- A lot of elements contain options to hover information or further actions. Just let your cursor run over various elements and discover how much data is actually packed into a tile.
- Click on Page header titles, RB titles, Section and Column Headers to access the tooltips containing descriptions of the report blocks, important hints, and links to the glossary. For tabs, the tooltip will be available by clicking only if the tab is currently active. Hint: Look for a dashed underline on clickable elements to identify those with tooltips.
- The Feature Counter above the left side of the report block displays the number of remaining polls or surveys compared to the total allocated for your plan. Click it to view all the limits of your current plan. Click the Increase your limits button to access the “Upgrade Plan” option.
- The poll will appear at the lower right corner of the website both for mobile and desktop. You can click the bubble to minimize the poll and then tap it again anytime to maximize it when ready to answer the questions.
- Polls or surveys will be visible on your live site in the order of creation, even if they were saved as a draft at first, paused, or ordered differently in your list. The same rule applies when more polls/surveys are set to Active at the same time as well.
Difference Between a Poll and a Survey

In general, the creation process of a poll and/or survey is identical. Also, the statistics and evaluations are the same. The main difference is that polls are being shown to your visitors directly integrated into your website, with the questions appearing in a little bubble while the surveys are presented to visitors or participants on a separate URL.
Important Notes:
- For longer questionnaires, it is recommended to use the surveys feature. Polls are ideal for presenting a short series of questions to your visitors.
- Survey links can be copied using the Share Survey icon in the main table. Embed this link on your website or share it with your visitors to enable them to answer the polls/surveys.
How to Create a Poll or Survey
To create a poll or survey that is both engaging and targeted to the right audience, we divided the process into four steps:
Questions

In order to make the creation of polls and surveys as simple as possible, the app offers pre-defined question types, which you can use according to your needs and preferences. Understanding these question types will help you easily choose the appropriate one for each question. Each poll or survey can contain a maximum of 65 questions.
Here are the question types that you can use on polls or surveys:
- Short Text Answer: Here you can enter a text question – and add a small description – which should only have a text reply with a lower character limit (280 characters).
- Long Text Answer: Here you can enter a text question – and add a small description – which should only have a text reply with a a higher character limit (4000 characters).
- Multiple Choice: Enter a text question and define the amount of choices you want to present to your participants. Each choice can be named individually. You can also add a description to the text.
- Slider: Here you'll find a slider for which you can add a question and a description. You can also define the labels which will be shown on the slider for participants.
- Shape Rating: This question type enables you to choose a certain pre-defined shape to be used instead of numbers on your rating scale (i.e. stars, hearts, thumbs up, etc.). You can define the number of rating elements just as their labels.
- Numerical Rating: This question type allows you to set up a certain numerical scale that you can connect to self-defined labels. You can define the number of steps within a scale by clicking on the "..."-icon right next to the question type dropdown.
- Email: This question type was specially designed to retrieve email addresses from participants. You can define your own text, a description, and whether you want to validate the mail address (an email will be sent to the given mail address and the receiver needs to confirm it). You will see whether a participant has confirmed his email address in the poll's/survey's stats.
- Phone Number: Here you can add a question type that allows your participants to easily add their phone number (incl. country code).
- Website address: This question type is a bit like the short/long text questions. The application simply checks whether the participant has entered a link in his reply.
- Date: For certain questions that require a date as an answer (i.e. "When would you like to attend the event we've just created?") this question type is the perfect fit.
Important Notes:
- All questions that you define can be saved within a question bank for later use – i.e. when creating a new poll/survey.
- Additional options and settings for every question (type) can be found right next to the question type dropdown. Just click on the "..."-icon and further options will be revealed.
- At the moment, all the questions must have an answer before being able to submit the poll/survey. We'll soon add the option to mark only the desired ones as mandatory.
Rule Based Targeting

After you have added all the questions to your poll or survey, you may customize it with the Rule based targeting options. In general, the application differentiates between the following targeting categories:
- Display Poll On: Specify whether you want to display the poll on all pages or only on specific pages.
- Hide Poll On: Select the specific pages of your website where you do not want this poll to be displayed.
Important Note: If you selected Specific Pages, you can choose from a list of your existing website pages (all pages with at least one visit recorded will automatically be listed), or specify further URL options like "exact match", "starts with" (in which case you must include the URL's protocol and its main domain), "contains" (any part of the URL) or "ends with" (includes all pages that end with this part of a stated URL).
Appearance
Our app offers a variety of personalization options to ensure that your polls and surveys align perfectly with your website and your brand identity. Customize elements to create a seamless and engaging experience with your audience.
Here’s how to customize the appearance of your polls and surveys:
Polls

- Language: You can customize your poll's language by selecting one of the pre-defined languages such as English, German, Spanish, Portuguese, Romanian, etc.
- Main color: Choose the main color of your poll to match your website and brand identity.
- Background color: Select the background color to match the main color. Play with it in order to find the perfect fit for you!
- Bubble Location: Select whether you want the bubble to be displayed at the left-bottom corner or at the right-bottom corner of your website.
- Add Logo: To make it more personalized, you can upload your own logo which will be shown directly in the bubble's top section. Please note the supported formats and sizes, PNG, JPG, SVG, with a maximum size of 1 MB.
- Padding: You have the option to add horizontal and/or vertical padding in pixels for the bubble's position.
- Allow to dismiss poll: You can enable the option to dismiss the poll.
Important Note: If you are subscribed to the required minimum pricing plan, you'll have the option to remove the label "Created using...".
Survey

- Language: You can customize your survey's language by selecting one of the pre-defined languages such as English, German, Spanish, Portuguese, Romanian, etc.
- Main color: Choose the main color of your survey to match your company identity and website.
- Background color: Choose the background color to match the main color that you have previously set.
- Add Logo: To personalize further, upload your own logo. Please note the supported formats and sizes (PNG, JPG, SVG, with a max. size of 1 MB).
- Estimated Time to Complete: Show your survey's participants the amount of estimated time it takes them to submit the survey and define the number of minutes.
Important Note: If you are subscribed to the required minimum pricing plan, you'll have the option to remove the label "Created using...".
Publish

Both polls and surveys can be easily published or activated. After you finished adding all the questions, selecting potential targeting options, and customizing the appearance, you can click on the "Publish" button in the upper right corner.
Important Hints:
- You also have the option of saving a poll/survey as a draft and activating it later.
- The polls/surveys will be visible on your live site in the order of creation, even if they were saved as a draft at first, paused, or ordered differently in your list. The same rule applies when more polls/surveys are set to Active at the same time as well.
Main Table of Polls/Surveys

As described, the overview tables for created surveys and polls are somehow identical. You will see the following columns (from left to right):
- Title: This shows the custom title you have set for the poll or survey.
- Status: Indicates whether a poll or survey is active, inactive or saved as a draft.
- Created at: The date the poll or survey was created, regardless of its current status ("Draft" or "Published").
- Published On: Displays the date when the poll or survey was published
- Initiates: The actual number of participants, which is the sum of "initiators" and those "participants that have fully completed the poll/survey". Initiators do not refer to participants who have fully completed the poll/survey. An initiator simply has initiated the poll/survey by answering at least 1 question but has not answered all questions.
- Responses: The total answers given by all participants to all questions. Note: One participant can answer multiple questions.
- Completion Rate: The ratio of participants that finished all questions of a poll/survey in comparison to the amount of people that replied to at least one question. Hint: You can also check each participant's completion rate individually within the participants table.
- Completion Time: The amount of time that participants spent on the average to complete all questions of a survey/poll. Note: The time of completion cannot be determined for one-question-polls/surveys. The poll needs to containt at least 2 questions overall, so that the completion time can be calculated.
- Further Options: Additional options you can choose from for each poll or survey. Read more here.
Settings and Further Options

- For active or inactive polls/surveys you will have 5 options:
- Share Survey (for surveys only): Copies the link of the survey to the clipboard.
- View stats for this poll/survey: Shows detailed information about the poll/survey including the results.
- Pause active polls/surveys or re-activate paused polls/surveys: Allows you to pause or activate any poll/survey.
- Edit/View poll/survey: You can view all polls/surveys but you can only edit the questions and preferences for those that are unpublished.
- Delete poll/survey (action cannot be reversed): Allows you to delete polls/surveys that are no longer needed.
- For polls/surveys in a draft state you will have 3 options:
- Activate poll/survey: Easily activate a poll or survey anytime.
- Edit/View poll/survey: You can edit or view your unpublished poll/survey and publish it once completed.
- Delete poll/survey (action cannot be reversed): Allows you to delete polls/surveys that are no longer needed.
Statistics and Evaluations

In order to evaluate the results and participants of your published polls and surveys, you have three main tabs for each published item available:
- General Statistics
- Question Results Detail (for Polls only) or Survey Results (for Surveys only)
- Participants (for Polls only)
General Statistics
The General Statistics tab will give you a detailed view of the following information:
- Initiations: Shows the actual number of participants, which is the sum of "initiators" and those "participants that have fully completed the poll/survey". Initiators do not refer to participants who have fully completed the poll/survey. An initiator simply has initiated the poll/survey by answering at least 1 question but has not answered all questions.
- Responses: Shows the total numbser of responses or answers given by all participants to all questions.
- Dismisses: (Only available for Polls) Shows the number of participants who left the poll without moving on to the next question.
- Completion Rate: Displays the completion rate which is calculated for all participants. It cannot be fully determined until at least one participant has fully completed the poll/survey.
- Completion Time: The average is calculated for all participants. The number cannot be determined until at least one participant of a poll/survey has fully completed the poll/survey. Note: The time of completion cannot be determined for one-question polls/surveys. The poll needs to contain at least 2 questions overall so that the completion time can be calculated.
Below the above-mentioned KPIs, you will see a funnel analysis of the polls/survey questions. Each question and question category are placed in a vertical column. On the right side of each question, you will see the number of participants that responded to the question and the completion rate. Underneath, you will see the percentage of dropout and the number of participants that left the poll/survey without moving on to the next question. This helps you identify questions that hold participants from submitting the entire poll/survey.
The first level is consistently displayed in green at the top, followed by the succeeding levels and the last level is consistently shown at the bottom. The coloring is dependent on the completion rate: low (red), medium (yellow), and high (green).
Question Results Detail / Survey Results

The second tab, Question Results Detail (for Polls) or Survey Results (for Surveys), will give you a more detailed view of the results.
The following information on this view:
- Question Number: It shows the corresponding question number.
- Question Type: Displays the question type.
- Number of Participants who replied to this question: Shows both the number of participants who answered this question and the overall number of participants for the poll.
- Question: Displays the entire question.
- Percentage: Shows the percentage of this answer to the overall answers for this question.
- Question: Displays the entire question.
- Number of Responses: This shows the number of responses for this specific answer.
Participants (Polls only)

The last tab in the statistics section of each poll provides you with precise information about the participants who have initiated/submitted the poll.
On this tab, you are being presented with the following columns (from left to right):
- Participant: The participants are categorized as follows:
- New Visitor: this visitor has not visited your website before
- Returning Visitor: this visitor has visited your website before
- Conversion Visitor: this visitor has visited a page you defined as a conversion page during his visit. Could be both a new or returning visitor.
- Visitor Location: Shows you which country/city a participant originates from
- Visitor Details: This shows more information about the participant - device used, OS, and browser.
- Completion time: This shows the amount of time it took the participant to complete the poll – only participants that fully submitted a poll will have this information displayed. Note: If partially answered, would only display "Could not be determined".
- Completion rate: Shows the percentage of completion which is computed from the number of questions answered compared to the total number of questions.
- Completed at: Displays the date when the participant has completed/submitted the poll.
- Further Options: Shows a link "View Responses" which allows you to view the complete list of the responses of the selected participant.
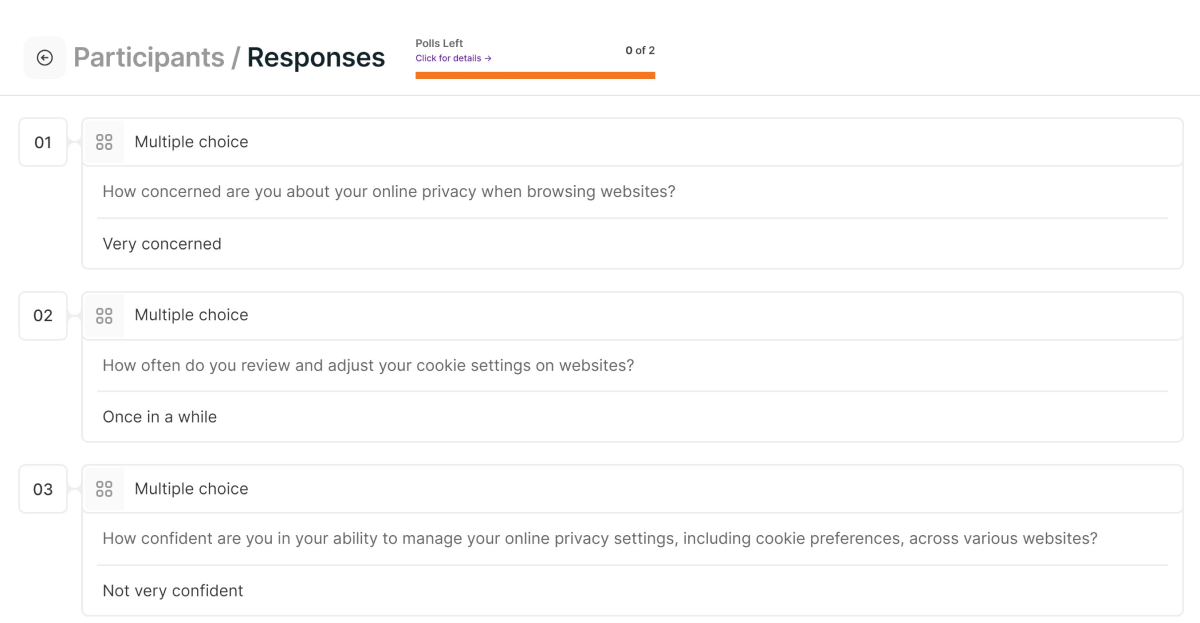
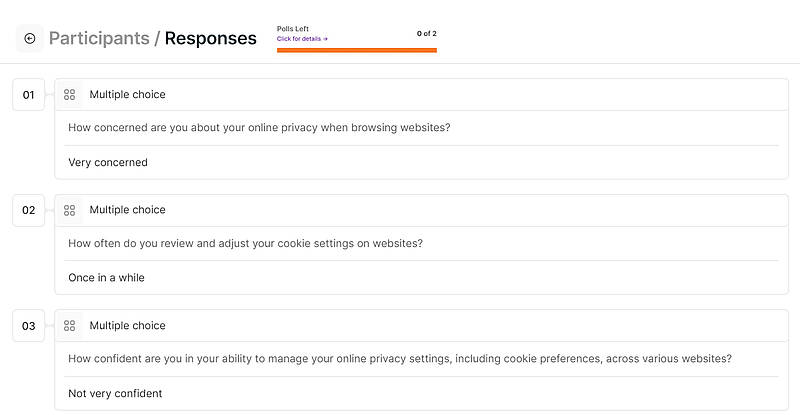
Important Hint: If you want to see only replies by a certain visitor type or from a specific country, you can use the filter option located in the upper right, just above the table.