- Why Us?
- Features
White Label
For SaaS Platforms & Agencies
Provide our complete analytics suite to your clients, directly within your own interface and with your/their own branding. Discover Analytics-as-a-Service and White Label Analytics. Great benefit, minimal effort.
- Pricing
- White Label
- Success Stories
- ResourcesGetting Started
-
Frequently Asked Questions
-
All About Features
- How to Install the Tracking Code
-
User Guides
-
Integrating With Other Platforms
-
Legal, Data Privacy & Certificates
- White Label Analytics
- Glossary
- Affiliate Program
- Contact
Conversion Funnels
See the Real Conversion of Your Website
The Conversion Funnels feature enables you to track how many sessions reached a specific page guided by a defined process, as well as identify the number of dropouts you had at any specific level. It is a very powerful tool, which makes it possible for you to easily check whether your visitors follow the paths you want them to follow, and reach the page you want them to reach.
To help you understand this feature better, we've divided the article into the following sections:
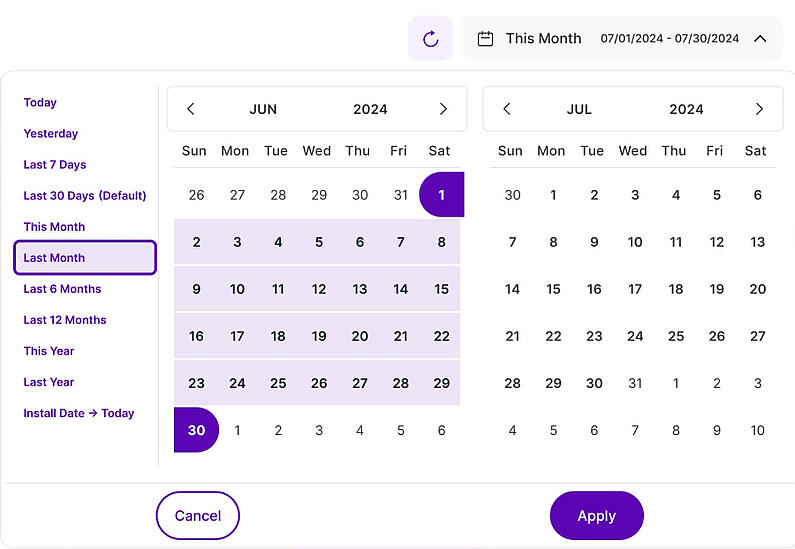
Right above the tiles, you can see a date picker. This enables you to select a certain time period, or specific day, for which you want the Dashboard's data to correspond.
It is crucial to limit the presentation of data to specific dates or timeframes during which you executed potential campaigns or implemented other strategies. This will allow you to assess the effectiveness of these actions and use the insights gained for future planning.
Important Note: The app now remembers previously set segments, filters, filter templates, and date intervals, even when you navigate away from the page, log out, or log back in. When your session expires or you close the tab, it automatically switches back to the default setting of "Last 30 Days."
Which Sessions Are Being Counted as Funnel Conversions?
Before you get started with your first funnel, it's important to understand how funnels work and which sessions are counted as conversions. The Conversion Funnels feature enables you to track the success rate of your defined (conversion) processes or procedures on your website. You can simulate any visitor journey on your website and see how many visitors leave a conversion path or actually pass through it completely.
Having a funnel set for a certain flow on your site, can be of great help to identify possible improvement possibilities on your website and much more. Please see the following example on what a funnel may look like:
Home -> Shop -> ProductX -> Cart -> Thank you
A -> B -> C -> D -> E
For every created funnel, sessions will be counted as converted, even if visitors navigate to other pages on your site between funnel levels. Even repeating the steps is allowed. The crucial factor is that a visitor must visit the funnel levels in the exact order during the session. As long as the funnel level order is respected, the session is counted as converted.
Hence, the following user journeys will be counted as converted for a funnel:
- A > B > G > C > I > D > E
- F > A > H > B > A > C > D > E
- A > B > B > C > D > E > E
If a visitor skips one of the steps, the conversion will not happen:
- A > B > D > E (missing funnel level "C")
In this case, the visitor will be counted as a dropout at level "B".
For help in creating your first funnel, more details can be found below at Create Funnel section.
Funnels are the best tool to retrace why visitors (potential customers) drop out of certain processes while navigating through your website.
With Conversion Funnels you can simply set up a path of websites in a certain order to construct a process you want your visitors to reach (e.g. buying a product: Homepage → Products page → Selection of product → Purchase item).
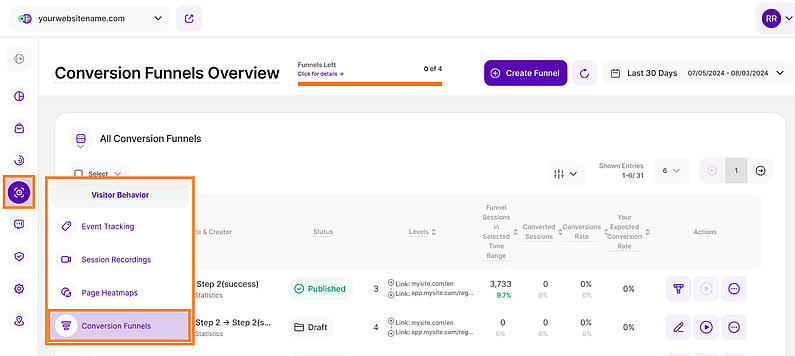
The Conversion Funnels sub-menu can be found under Visitor Behavior in the main navigation bar.
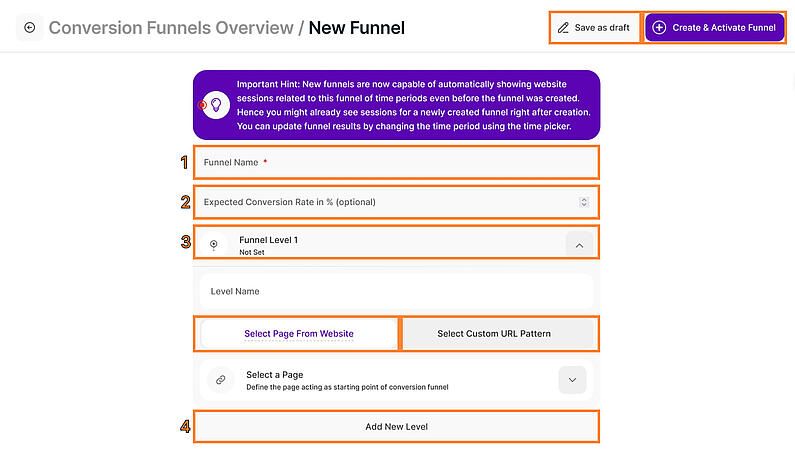
In order to set up a new funnel, you have to click on the button “Create Funnel” button in the upper right corner of the Conversion Funnels Overview. The steps are structured as follows:
- Funnel Name: Here you can choose whatever name you think is suitable for this funnel and which allows you to find it easily in the overview.
- Expected Conversion Rate in %: This is an optional setting that you can add for overview purposes. It will later be displayed on the funnel detail page, allowing you to compare the actual conversion rate with the expected one you provided here. This gives you an insight if you were able to hit your goal conversion rate or how close you are to your target.
- Funnel Level: This represents the current number of levels in the newly created funnel. The information is filled out automatically while you add more and more levels to the funnel. Please note that the maximum number of levels a funnel can currently have within the application is 8. Create the Level Name then click the arrow button and select one of these options:
- Select Page From Website: This will give you a dropdown of all pages that the application detected for your website. It shows the page title and the URL.
- Select Custom URL Pattern: If you want to choose a more advanced way of setting a level up for your funnel, this option will help. A new dropdown will appear, containing the following options for you to choose from:
- Simple url match: this targeting model includes all elements of the page URL. Including any fragments or query strings, protocol or the addition of “www”.
- Exact url match: only targets a specific URL with its protocol. The URL can also contain a fragment or query string.
- URL starts with: only targets URLs that start with the value you entered.
- URL ends with: only targets URLs that end with the value you entered.
- URL contains: only targets URLs that contain the value you entered
- Add New Level: Here you can add another level to your funnel, following the same options as described above.
For instance, you cannot have a page of www.website-one.com domain on level 1 and a page of a different domain www.website-two.com on level 2, unless the other domain has been whitelisted and it is tracked accordingly.
As soon as you have filled out all the information needed and added all the levels you wanted, you can either select “Create & Activate Funnel” directly or “Save as draft” and then activate it later.
After you have set up the funnel and data has been collected you will be ready to do some funnel analytics, by seeing how many of your visitors dropped out at each step. This will allow you to analyze why the visitors left the page and thus improve your UI in order to achieve higher conversion rates and increase the amount of visitors going through an intended process entirely and reaching goal completion.
Important Hints:
- “Visitor Limits” has been removed.
- Further information about each of the URL patterns, can also be found here.
- Make sure that when defining a URL pattern, the URL filled in is still part of the selected domain and not a different one (unless the other domain has been whitelisted within your settings).
- For every created funnel, sessions will be counted as converted, even if visitors navigate to other pages on your site between funnel levels. The crucial factor is that a visitor must visit the funnel levels in the exact order during the session. As long as the funnel level order is respected, the session is counted as converted. Even so, if a visitor skips one of the steps, the conversion will not happen.
- You can currently add a maximum of 8 levels per funnel.
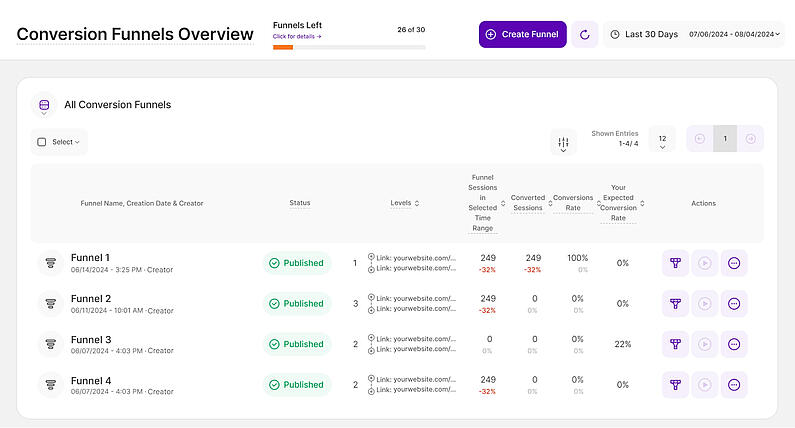
Every time you create a new funnel, a new row is added to the Conversion Funnels Overview table. By default, it is displayed in a table view with the following columns (from left to right):
- Funnel Name, Creation Date & Creator: This column displays the name of the funnel, the date and time it was created and the name of the creator.
- Status: Displays the current status of the created funnels if it's Published or Draft.
- Levels: Shows the number of levels and the URLs of the first and last levels you have added.
- Funnel Sessions in Selected Time Range: This column shows the number of sessions that were already tracked for this funnel. The higher the number, the more relevant the information is.
Important Hint: New funnels are now capable of automatically showing funnel sessions of time periods even before the funnel was created. Hence you might already see visits for a newly created funnel right after creation. You can update funnel results by changing the time period in the date picker. - Converted Sessions: Shows the amount of converted sessions.
- Conversions Rate: Displays the percent-wise how many sessions have been converted.
- Your Expected Conversion Rate: This is the conversion rate that you have set as a reference when creating the funnel. The closer, the better.
- Actions: In this column, you'll find three options to choose from:
- View Funnel Details: Click this icon to enter the detail view of the selected funnel.
- Activate: only for funnels on Draft status
- Three dots menu icon: Shows three more options - Edit Funnel Name, Copy Funnel's Link and Delete Funnel.
Important Notes:
- To delete a single funnel, select it's individual tile.
- To delete multiple funnels, tick the box next to "Select" on the top left of this report block and choose "All". Untick the boxes for the funnels you do not want to delete. Then, click the "Select an Action" dropdown and select "Delete All Selected Funnels".
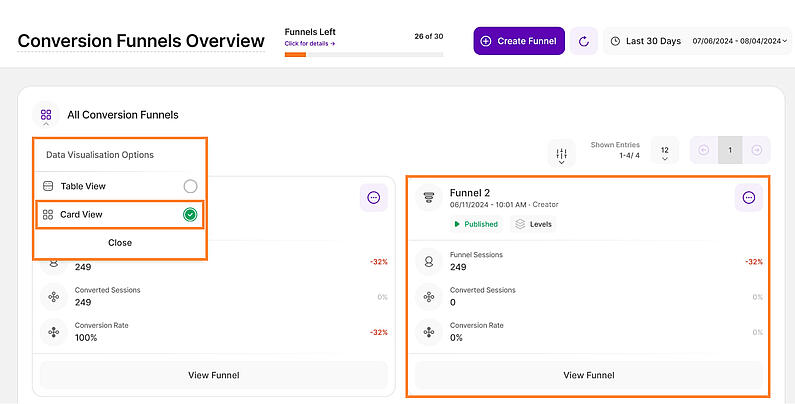
Alternatively, you can switch the view by tapping the Menu Icon on the top left of this report block, then selecting "Card View" from the drop-down list. Instead of the default, which is the table view discussed in the Conversion Funnels Overview, you will now see the conversion funnels individually displayed on each card.
You'll discover fundamentally the same information here, but opting for this would be the best choice if you wish to concentrate on the metrics of each conversion funnel.
On the top portion of the card, you will find the funnel name, creation date, and name of the creator. Below it, you'll find the funnel’s current status and levels. Hover over "Levels" to display the names of each funnel level, the custom URL pattern, and the associated URL.
You will also find the number of funnel sessions that have been tracked for this funnel, the number of converted sessions, and the actual conversion rate.
At the bottom of each card, you’ll find the “View Funnel” button. When clicked, it will lead you to the detail view where you can see complete details, including the option to watch a video of the dropouts.
On the Conversion funnels Overview, you can use filters to understand the data at a granular level. There are two filters available:
- Funnel Name: Enter the complete funnel name or at least a portion of it. This will filter funnels containing the entered word or phrase.
- Status: You can choose between:
- Published: Funnels that have been published and gathering data. Note that unlike heatmaps, there is NO possibility to pause the collection of data. You would have to create a new funnel for this.
- Drafts: Funnels that have been created but not activated yet. It can be activated at any point in time.
You can also customize the number of entries shown per page and easily navigate through the data using pagination.
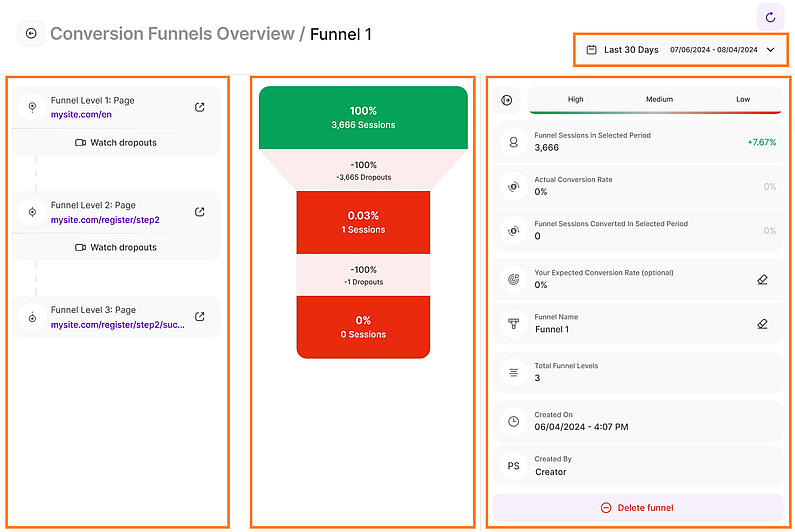
Once you have entered the detail view of a funnel, there is a lot more valuable information available. This acts like a funnel report.
Remember that a funnel represents a certain process that you have defined. From a bird's eye view, you will see the exact shape of the funnel, constructed from the number of levels you have added to it.
The first level is consistently displayed in green at the top, followed by the succeeding levels and the last level is consistently shown at the bottom. The coloring is dependent on the conversion rate --low (red), medium (gradient of red and green), and high (green).
The view is structured by the following main elements (compare with the screenshot above):
- Date Picker: Using the date picker, you can filter the results of a funnel based on a certain period of time. The funnel could be different in the first weeks in comparison to the weeks after (maybe you did a change on the corresponding pages to improve your conversion rate).
- Funnel Sessions in Selected Period: The total number of sessions received by this funnel. It also includes a percentage that shows the comparison to the previous period, helping you track changes in funnel activity over time.
- Actual Conversion Rate: The actual amount of conversions.
- Funnel Sessions Converted In Selected Period: Displays the number of sessions that have been converted and a percentage that shows the comparison to the previous period.
- Your Expected Conversion Rate (optional): This is the number of conversions set when creating the funnel. This can be edited.
- Funnel Name: The assigned name for your funnel. This can be edited.
- Total Funnel Levels: Shows the total number of levels you defined when creating the funnel.
- Created On: Shows the date and time when the funnel was created.
- Created By: Shows the name of the person who created the funnel.
On the left side of the funnel diagram, you can view the funnel levels, URLs assigned to each level, and the dropouts recorded for each level. This is an important aspect so you can monitor where, at any given level, the visitors dropped out.
Important Hint: As mentioned above, other visits in between levels are allowed, as long as the order of the steps set in the funnel, is followed as such.


